
Figures & data
Table 1. Description of the features.
Figure 1. Heatmap of the Pearsons correlation.
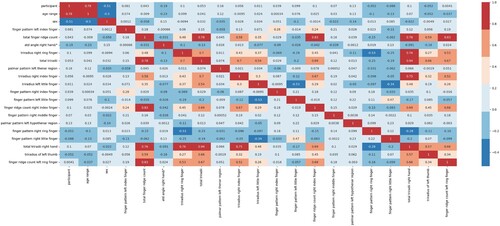
Figure 2. The features are ranked in relevance by the Mutual Information Algorithm.
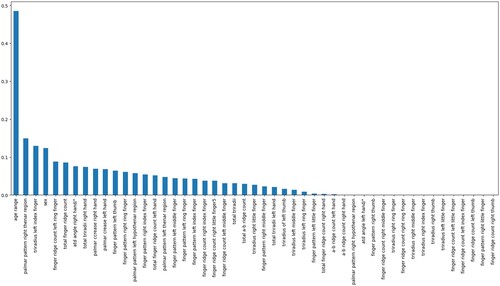
Table 2. Methods and the features.
Figure 3. The Visual representation of customized stacking
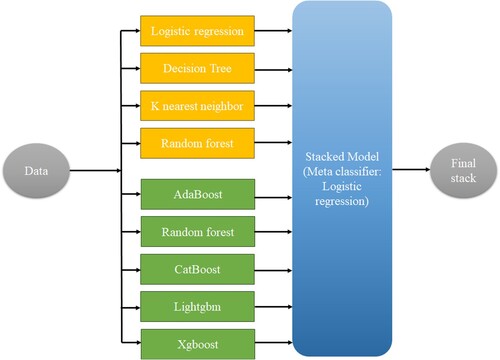
Figure 4. Represents the Flow chat of the voting methodology used in the study.
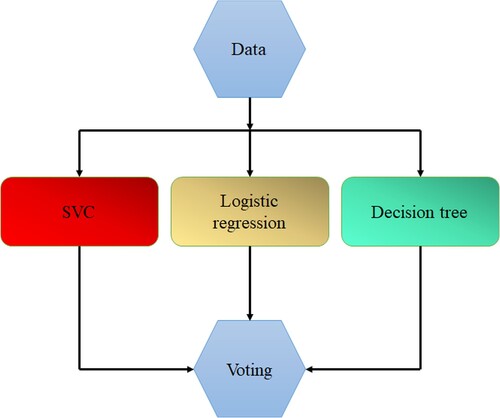
Figure 5. The pipeline of the machine learning methodology used in the study.
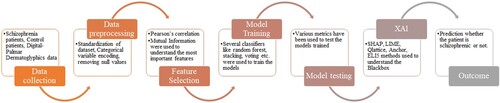
Table 3. All the classifiers with its accuracy, precision, recall and F1 score.
Figure 6. AUC curves for (a) Logistic regression, (b) SVM – linear kernel, (c) Ridge classifier
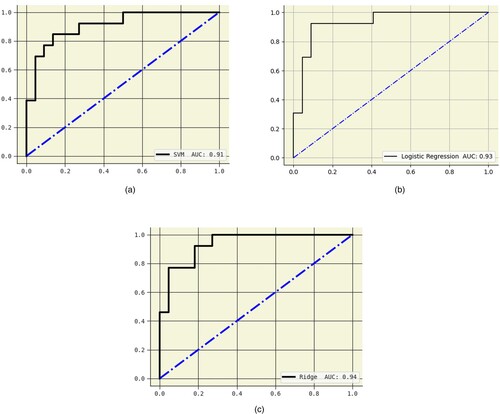
Figure 7. Precision-recall (PR) (a) Logistic regression, (b) SVM – Linear kernel, (c) Ridge classifier
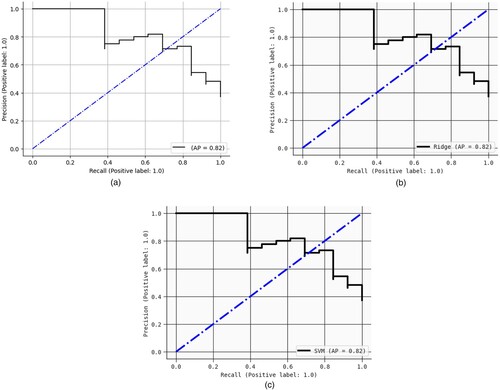
Figure 8. Confusion matrix of (a) Logistic regression, (b) SVM – linear kernel, (c) Ridge Classifier
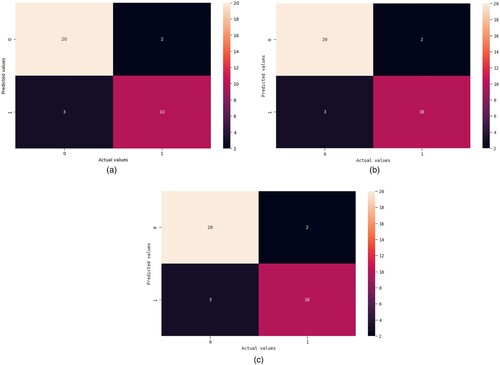
Figure 9. Beeswarm plot for SHAP (a) Beeswarm plot of 20 features (b) SHAP explainers for the 20 features
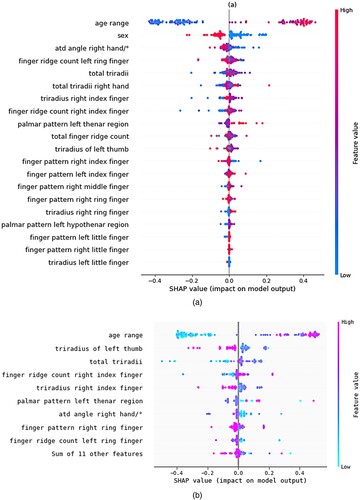
Figure 10. Attributes contributing for schizophrenic and not are represented by LIME.
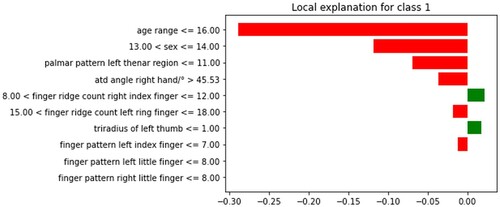
Figure 11. Model predictions explained with QGraph.
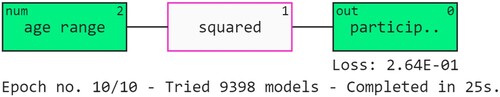
Figure 12. Eli5 to explain model predictions.
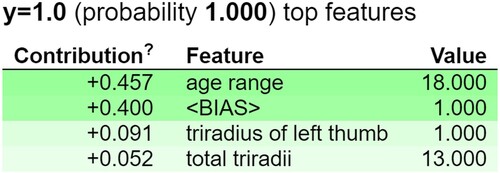
Table 4. Five patients with schizophrenia and five patients without schizophrenia had anchor explanations.
Table 5. Comparison between our proposed model and the existing models.
Data availability statement
Data will be made available after obtaining prior permission from the corresponding author.