
Figures & data
Table 1. Overview of the 6 steps: questions, statistics and criteria for decision.
Figure 1. Endorsement frequencies for RM-SIP items from least endorsed to most endorsed.
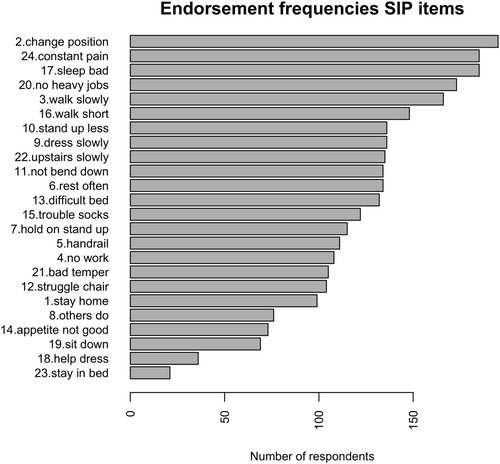
Table 2. Mokken Scaling for SIP items: aisp algorithm at increasing homogeneity thresholds.
Figure 2. Joint Item Characteristic Curve (ICC) plot and person-item map for the 15-item RM-SIP.
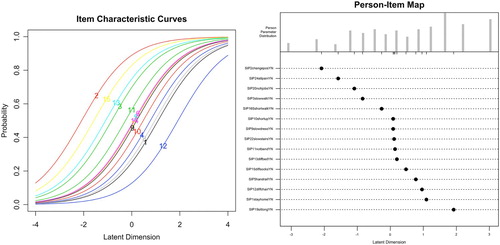
Figure 3. Parallel analysis and Very Simple Structure (VSS) plots for the 24-item RM-SIP.
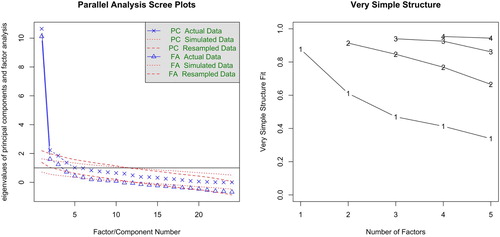
Table 3. Bivariate correlations (Pearson's r) between illness perceptions, pain intensity, and 15-item and 24-item RM-SIP.
Table 4. Multiple regressions of 15-item and 24-item RM-SIP (n = 222; non-standardized estimates and standard errors).
Supplemental material