Figures & data
Figure 1. Plot of adaptation linearly regressed on adversity in a continuous residuals model. * The residual values, i.e. distance from the fitted regression line indicated by the dotted line, quantify the level of resilience.
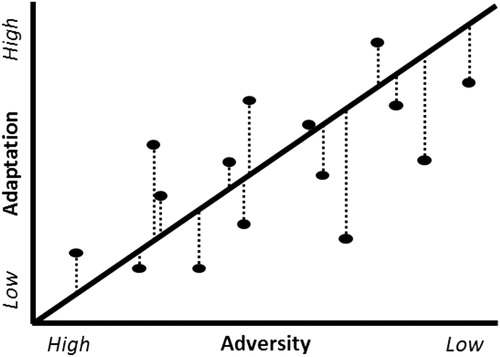
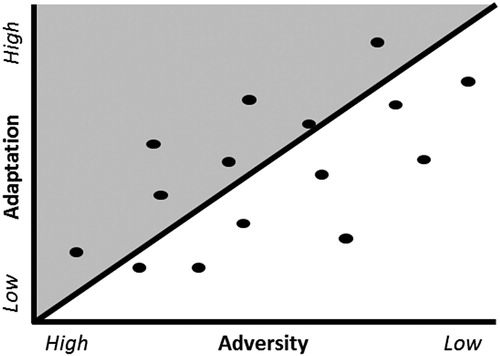
Figure 2. Plot of adaptation linearly regressed on adversity in a categorical residuals model. * The shaded area identifies individuals as ‘resilient’.