
Figures & data
Figure 1. Illustrative example data shown in Excel in the appropriate format for subsequent N-of-1 analyses.
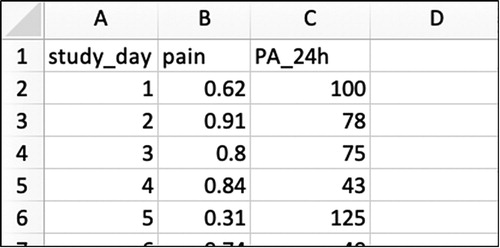
Figure 2. Menu options for plotting time series data in SPSS.
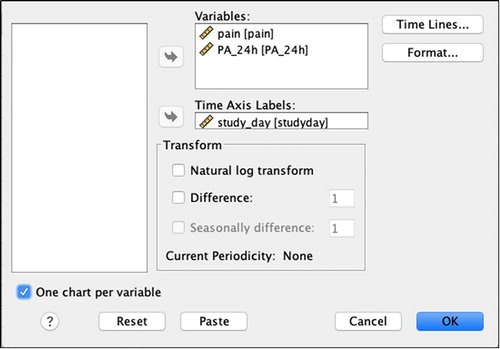
Figure 3. Time plots, produced by SPSS, displaying daily pain and physical activity over the study period.
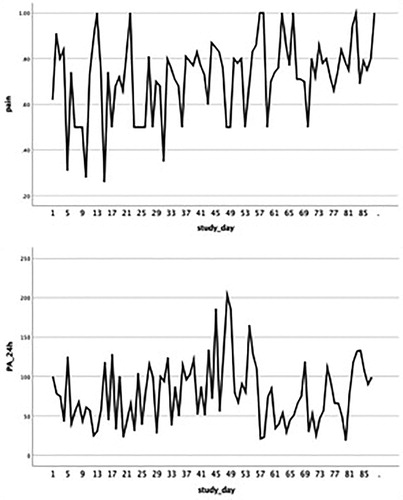
Figure 4. Output after partitioning the data.
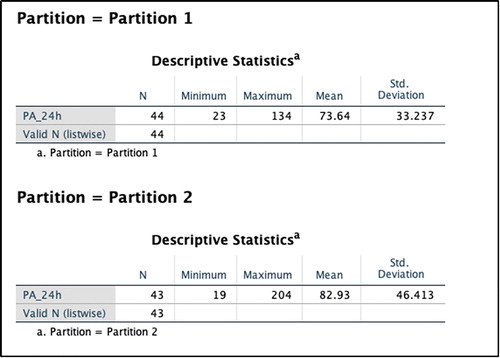
Figure 5. Menu options for regressing the outcome variable on the predictor variable(s) to identify whether a linear time trend exists in the data.
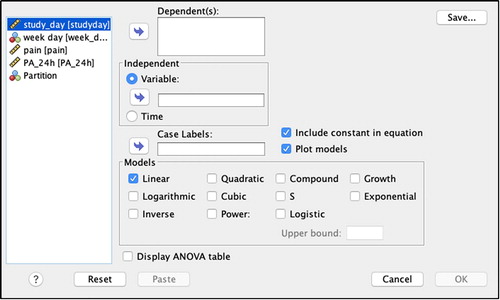
Figure 6. (a) Scatterplot showing stable time-series dispersion indicating possible non-existence of a trend. (b) Scatterplot showing a significant linear time trend in PA, with a decrease in PA over time (for comparison purposes).
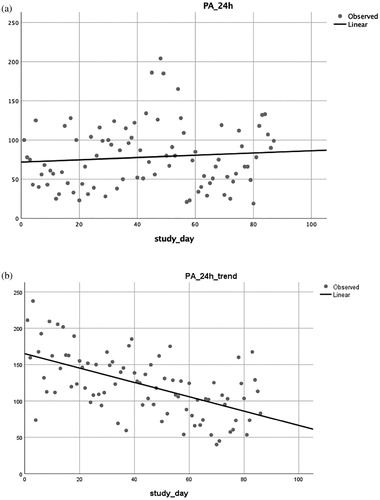
Figure 7. Autocorrelation and partial autocorrelation correlograms for physical activity, produced by SPSS.
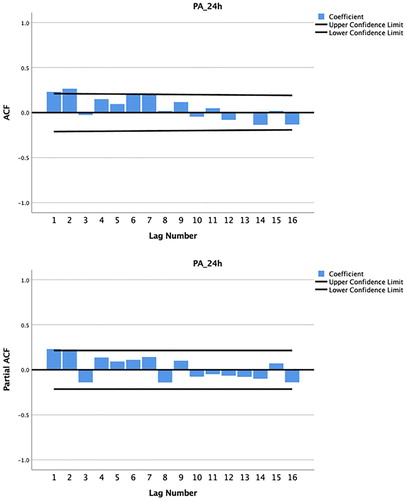
Figure 8. Menu options for creating a lagged variable.
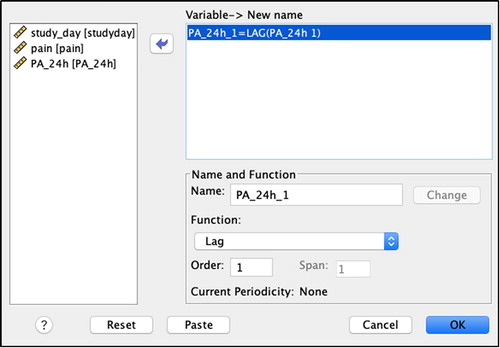
Figure 9. New lag1 outcome variable created in SPSS (‘PA_24h_1’).
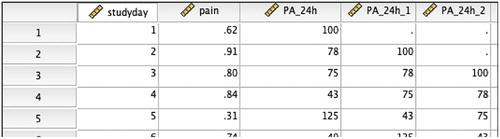
Figure 10. Autocorrelation and partial autocorrelation correlograms for physical activity, produced by SPSS.
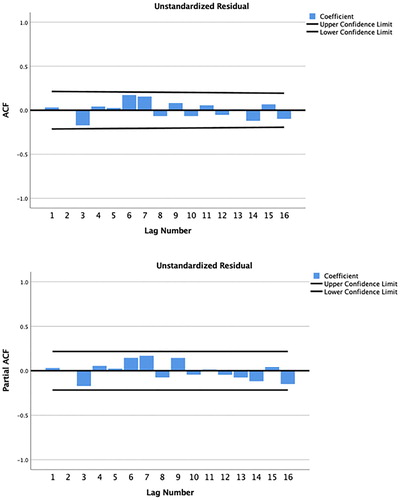
Figure 11. Menu option for entering lagged variables as predictor variables, to control for autocorrelation at the appropriate lag(s).
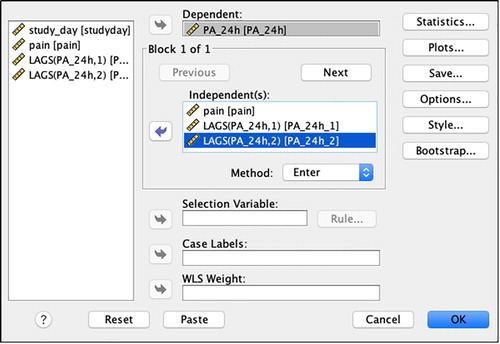
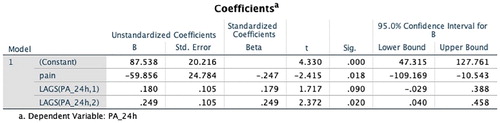
Figure 12. Dynamic regression results – Coefficients table from SPSS.
Supplemental Material
Download Zip (1.9 KB)Data availability statement
The SPSS dataset and syntax are available within the supplementary materials.