Figures & data
Table 1. CASP checklist results for included studies.
Figure 1. Flow of information through the different phases of the systematic review (based on the PRISMA reporting flowchart).
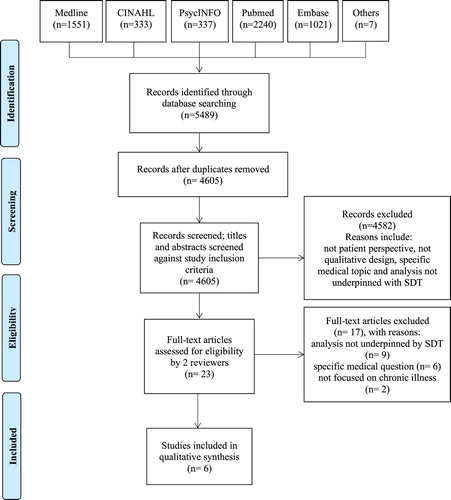
Table 2. Summary of included studies.
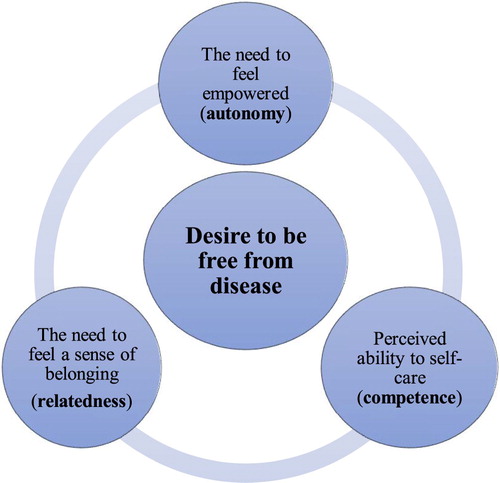
Figure 2. Conceptual diagram of the overarching theme and the sub-categories using framework synthesis.