Figures & data
Table 1. Correlations and Descriptive Statistics for the Main Variables of Study 1.
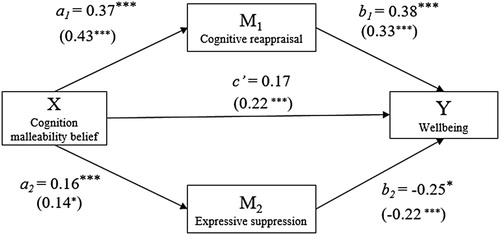
Figure 1. Model coefficient results of the bootstrapping analysis.
Note. Coefficients are unstandardized. *** p < 0.001, * p < 0.05. Statistics in parentheses are results from Study 2.