
Figures & data
Table 1. Selected sociodemographic, physical activity, and sitting-related characteristics of the sample.
Figure 1. Path model of automaticity facets of active commuting and screen-time sedentary behaviour, predicting objective measured physical activity and sitting time. Active Commuting sample (n= 84); Screen-based sedentary behaviour sample (n= 75). * p ≤ .05; ** p ≤ .01.
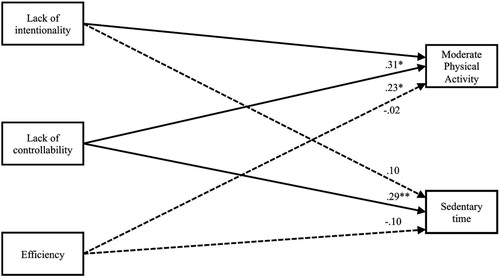
Table 2. Student t-test Results Comparing Participants Who Adopted Behaviours on Automaticity facets and Accelerometer outcomes.
Table 3. Pearson correlations (r) of Active Commuting and Sitting-Time Sedentary Behaviour for automaticity and accelerometer.
Supplemental material