
Figures & data
Table 1. Description of Respondents (N=819) on Demographic Characteristics.
Figure 1. (A) Group differences in the indices of health literacy and eHealth literacy (n=627). (B) Group differences in the dimensions of health literacy and eHealth literacy (n=342).
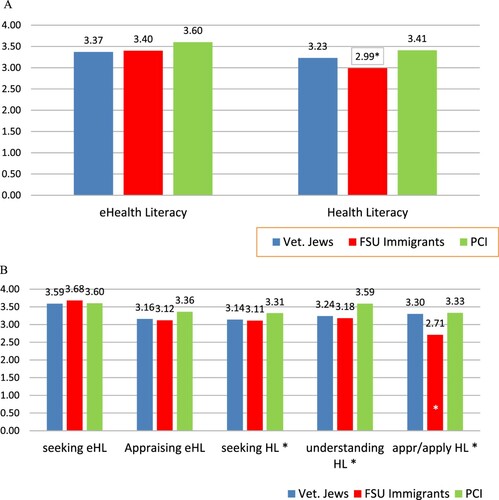
Table 2. Intercorrelations between main variables.
Table 3. Hierarchical Linear Regression on Self-rated Health, Healthcare Utilization and Perceived Outcomes of Internet Use; Testing Moderation by Group.