
Figures & data
Figure 1. Flowchart demonstrating the recruitment and analysis processes used in the study. This figure shows that 86 patients were approached to participate in the survey, of whom 4 declined and 82 completed the survey. The figure also shows that 22 patients were approached to participate in the interview, of whom 2 decline and 20 completed the interviews. Quantitative analysis was conducted for the whole sample, n = 102 and qualitative analysis was conducted for the interview sample, n = 20. Qualitative analysis led to an understanding of the interconnectedness of the themes that emerged. Mixed methods analysis like triangulation, used interview data to explain results of quantitative analysis (regression).
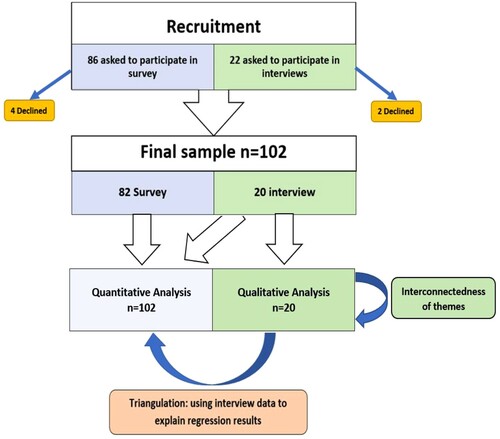
Table 1. Sample characteristics of the study population, including demographic, medical and reproductive history.
Figure 2. Distribution and Mean FertiQoL core and domain scores for the sample, n = 102. This box and whisker plot shows the distribution of the FertiQoL core and domain scores in this sample. In this figure, minimum (lower whisker), first quartile (bottom of the box), median (line in the middle of the box), third quartile (top of the box) and maximum (upper whisker) are displayed. Means are written in the centre of each box. The dots indicate outliers in the sample. The * and + indicate that paired t-tests of means for those scores were statistically significant at p < 0.05.
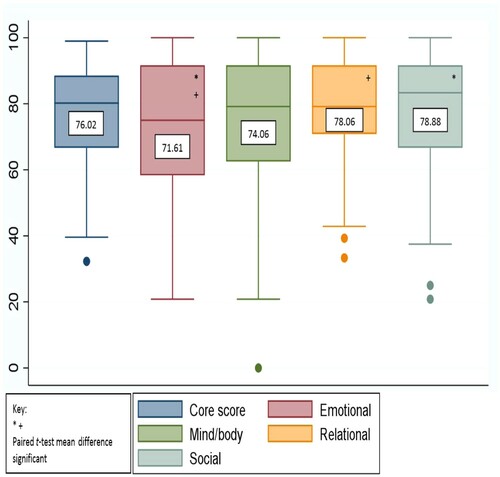
Figure 3. Distribution of FertiQoL core score by GENDER. This figure shows the difference in the distribution of FertiQoL core scores for men and women. The blue distribution is for women’s scores and the overlay outline distribution is for men’s scores. The figure shows that both distributions were skewed to the right (higher scores), however, most men scored much higher than women, and women had a wider distribution of scores. This indicated that in this sample, while both men and women reported high scores, on average men scored higher than women and there was more variability in the women’s scores.
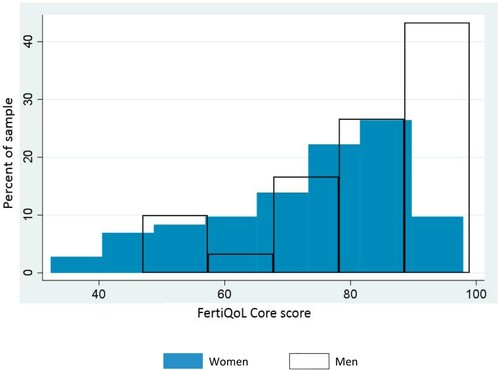
Table 2. Regression model demonstrating the relationship between FertiQoL core and domain scores with the health and socio-demographic variables.
Table 3. Analytic scheme for themes that emerged from qualitative data analysis displaying the four themes, sample sub-themes, codes and quotes.
Table 4. Illustrative quotes demonstrating when faith-based coping and non-faith-based coping were used in relation to the other three main themes.
Figure 4. Conceptual framework for qualitative analysis, the thematic map of interconnectedness of themes. In this figure, the thematic map illustrates the interconnectedness of the four main themes that emerged through thematic analysis. The figure shows that the impact of infertility on social or spousal relationships would require coping if it led to a state of internal distress. The figure also shows that spousal and social themes overlapped.
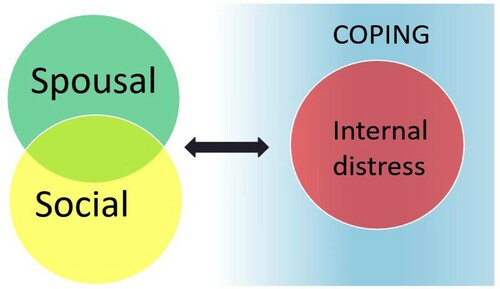
Table 5. Triangulation of thematic analysis of coping by gender, using illustrative quotes to help explain results of the regression analysis that identified gender as an independent factor associated with FertiQoL core, emotional and relational domain scores.