
Figures & data
Figure 1. Conceptual Model of Wellness. This Venn diagram illustrates the proposed conceptual model which includes physical wellness indicators, positive affect, sense of engagement, being impervious to negativity from others, having the resources to be kind to others, and being able to retain a sense of perspective.
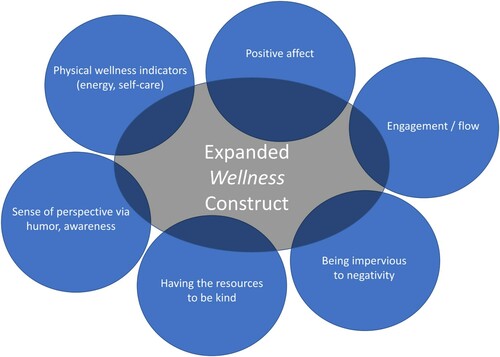
Table 1. Sample demographic characteristics (N = 4,816).
Table 2. Descriptive statistics of person-reported outcomes used for construct validity.
Figure 2. Bifactor Model of Wellness. This bifactor model comprises one general factor and four specific factors. Incorporating the specific factors’ residual correlations into the general score enables the creation of a short-form measure that represents multiple sub-domains within a broader construct.
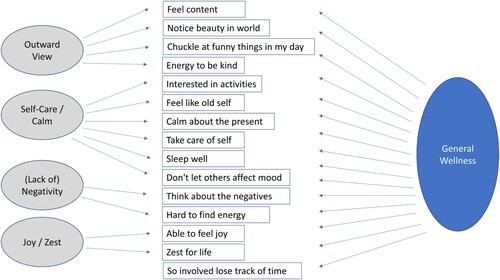
Table 3. Confirmatory Factor Analysis: Two-group Bifactor Model Loadings (n = 4,815).
Figure 3. Score Reliability Across the DQ Wellness General Score. The DQ Wellness score exhibits high reliability across all levels of the summed score, and thus, across the full range of the latent trait of Wellness.
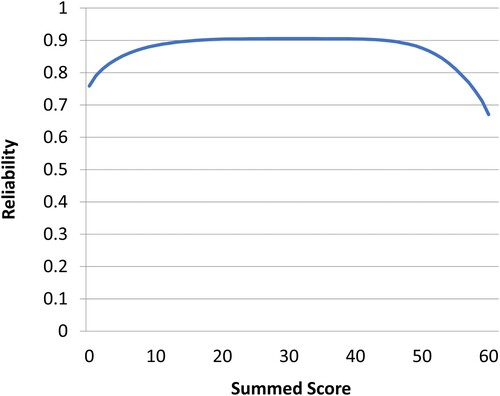
Figure 4. Paneled Histogram of the DQ Wellness General Score by Comorbidity Burden. As numbers of comorbidities increase, the mean and distribution of the DQ Wellness general score shift lower.
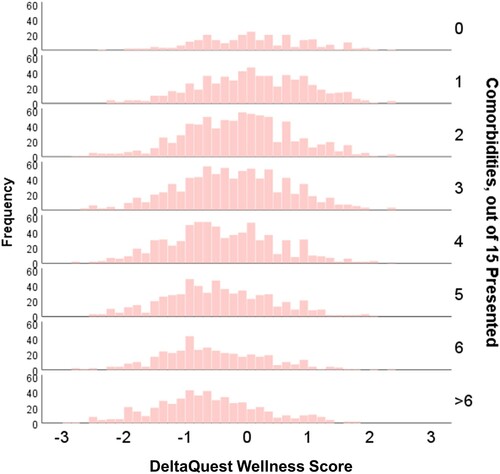
Table 4. Multivariate Regression Model Predicting General Wellness Score (Adjusted R2 = 77.2%).
Table 5. Results of measurement invariance analyses by gender.
Supplemental Material
Download Zip (1.8 MB)Data availability statement
The study data are confidential and thus not able to be shared.