
Figures & data
Figure 1. Screenshot of the intervention video with the communication strategies based on Self-Determination Theory (content translated from German to English).
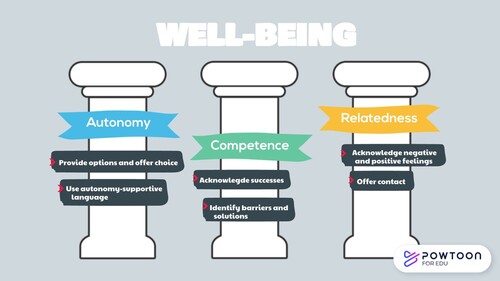
Figure 2. Participant flowchart for Study 2.
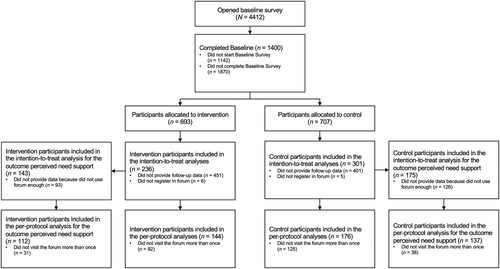
Table 1. Baseline characteristics and participant differences in the control and intervention conditions (Study 1).
Figure 3. Mean number of need-supportive communication strategies used (Study 1).
Note: Means and standard errors (error bars) for the number of need-supportive communication strategies used in the responses to fictive online postings, by measurement time and experimental condition.
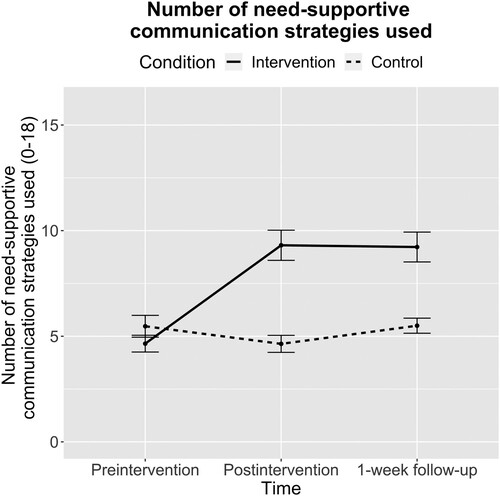
Table 2. Baseline characteristics and participant differences in the control and intervention group (Study 2).
Figure 4. Percentage of postings with a specific number of need-supportive communication strategies based on Self-Determination Theory by experimental condition (Study 2).
Note: The maximum possible number of strategies per posting is 6. Error bars represent 95% confidence intervals.
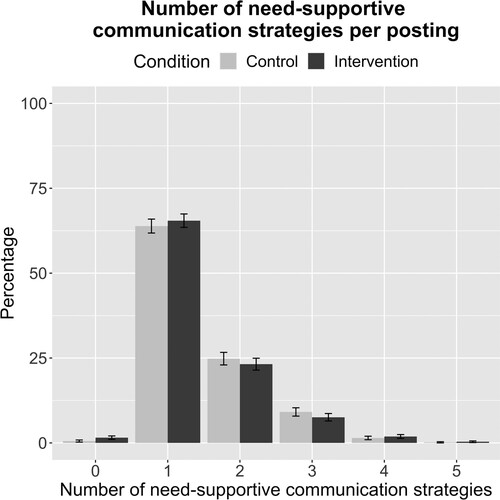
Table 3. Intervention effects and estimated marginal means for intervention and control condition from mixed models (Study 2).
Supplemental Material
Download MS Word (598 KB)Data availability statement
The data that support the findings of this study are openly available in the Open Science Framework at https://osf.io/xsb2e/.