
Figures & data
Figure 1. (a & b). A visual illustration of the co-twin and within-person procedures. The demonstrated procedures are simplified for ease of comprehension, and we refer to the Supplemental data for a review of the specific centering techniques applied in our study. (a) demonstrates how within-pair correlations are calculated, by subtracting the twin pair average phenotype scores from the score of each twin. The resulting centered score provides a measure of each twin's distance from the twin pair average, which is then free from genetic influences. Likewise, (b) demonstrates the application of the same procedure to two measurement timepoints within one individual. The within-person correlations are calculated by subtracting the person average phenotype scores from the phenotype scores at each timepoint. The resulting person centered scores provides a measure of each timepoint's distance from the person average, which is then free from influences from the stable non-shared environment.
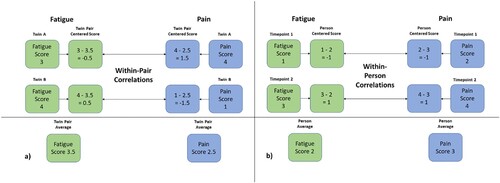
Table 1. The distribution of responders organized by their own contribution to the study as well as their co-twins’, separated by zygosity.
Figure 2. The hierarchical data structure to which the multilevel modeling was adapted. The numbering at the various levels indicate allocation of timepoints within persons within zygotes within twin pairs. Monozygotic (Mz) twins are nested together at both level 3 & 4, while dizygotic twins (Dz) are nested together only at level 4.
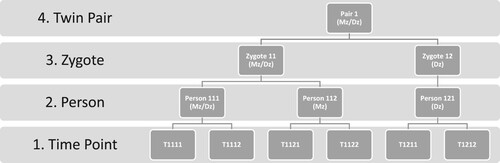
Figure 3. Adjustments made in the final four models estimated, showing each incremental control condition. Model 5 adjusts the main effects with a co-twin condition, while model 6 adjusts the main effects through a within-person control condition. Model 7 includes comorbidity indicators as observed covariates, to evaluate confounding from somatic illness. While the model adjustsments allow for a comprehensive control, they do not, however, allow for the control of potential confounding by unmeasured time-varying factors such as the effects of life events in between measurements.
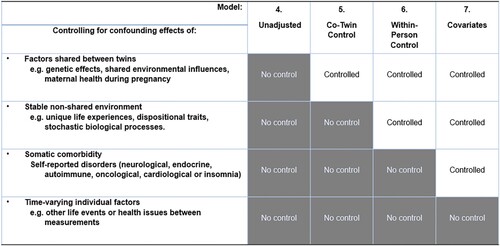
Table 2. Phenotypic correlations between included variables at both time points, T1 = 2011 and T2 = 2016.
Table 3. Variance component models of all included variables, with variance compartmentalized into levels of additive genetic variance, stable non-shared environmental variance and varying non-shared environmental variance, with 95% confidence intervals (95% CI).
Figure 4. The multilevel regression model separates the additive genetic, stable non-shared environmental (Stable NSE) and varying non-shared environmental (varying NSE) components of the included phenotypes, and provides level-specific coefficients of distress and pain on fatigue. This is estimated through genetically weighted within-pair correlation, within-person stability and within-person variability. The model is strictly illustrative, and it should be noted that other possible models of the relationships between fatigue, pain and distress cannot be eliminated based on our findings.
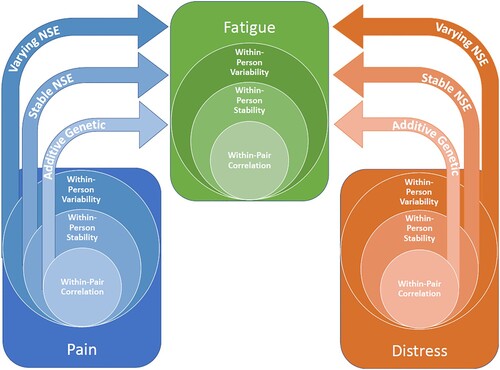
Table 4. Fixed effects with (95% Confidence Intervals) of level-specific coefficients for psychological distress and musculoskeletal pain, and residual variance components for each incremental modeling step with percentages of explained variance.
Table 5. Fixed effects for the final model with observed comorbidity covariates (Model 7), with estimated regression coefficients (β), standard errors of the estimates (S.E.) and p-values generated from Wald-tests of significance.
Supplemental Material
Download MS Word (72.9 KB)Data availability statement
The relevant estimates and data for this study have been made available in this manuscript. Due to restrictions from the Norwegian Twin Registry (organized by the Norwegian Institute of Public Health) and privacy restrictions, individual twin data is unavailable for the public. Information on applications for data access can be found here: https://www.fhi.no/en/more/health-studies/norwegian-twin-registry/