
Figures & data
Table 1. Socio-demographic characteristics of the sample and differences between the urban and rural sample.
Table 2. Modern eating items and results of linear regressions with modern eating items as dependent variable and urban-rural as independent variable (n = 120).
Table 3. Traditional eating items and results of linear regressions with traditional eating items as dependent variable and urban-rural as independent variable (n = 120).
Figure 1. Percentage of participants who responded to show the modern eating behaviors from never to always for the urban and rural samples (n = 120). Note. Items are sorted by their overall mean in ascending order. Full item names are displayed in . * p < .05; ** p < .01; *** p < .001.
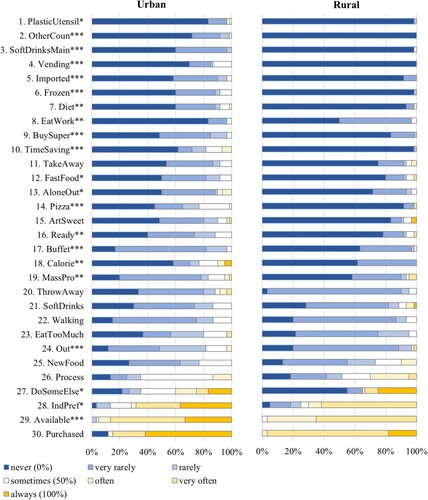
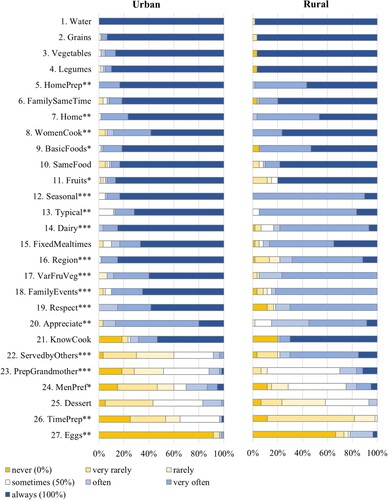
Figure 2. Percentage of participants who responded to show the traditional eating behaviors from never to always for the urban and rural samples (n = 120). Note. Items are sorted by their overall mean in descending order. Full item names are displayed in . * p < .05; ** p < .01; *** p < .001.
Supplemental Material
Download MS Word (171.8 KB)Data availability
Data are available upon request from the lead author.