
Figures & data
Figure 1. A flow diagram of patients in Part 1 and Part 2.
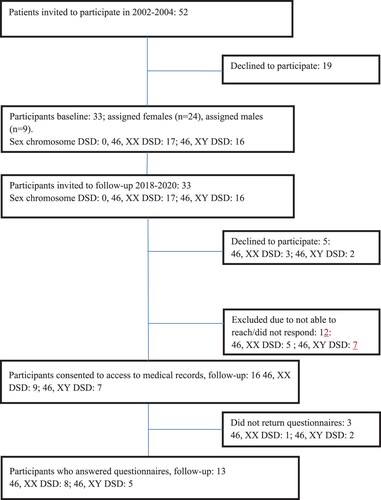
Table 1. Participants, with diagnosis classification.
Table 2. DSD group compared with the control group.
Table 3. Adolescents assigned 46, XX females, 46, XY females and control group (age 10–18 years).
Table 4. Adolescents, 46, XX DSD vs. 46, XY DSD females, without control (age 10–18 years).
Table 5. Quality of Life (QOLS), distress, psychopathology and well-being (GHQ-30), follow-up. (N = 13).
Data availability statement
The data that support the findings of this study are available on request from the corresponding author.