
Figures & data
Figure 1. Decisional algorithm about the acceptability of adaptations made to CdM?.
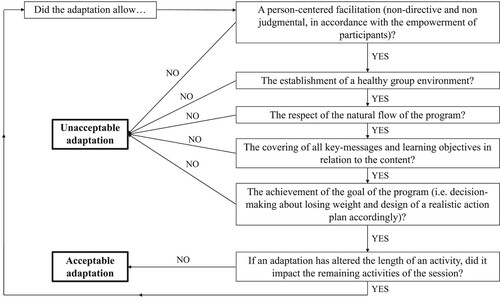
Figure 2. Flowchart of providers recruitment.
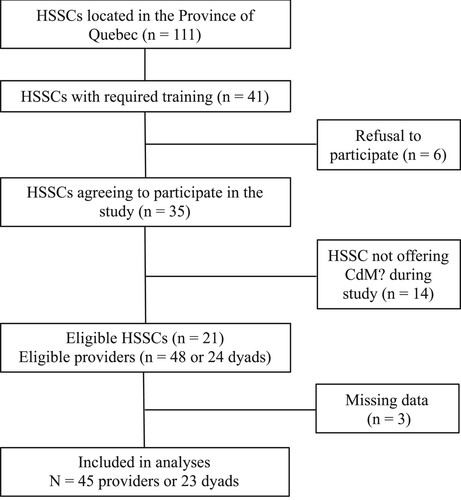
Table 1. Descriptive statistics of CdM? participants at baseline.
Table 2. Descriptive statistics of CdM? providers’ characteristics by their occupation.
Table 3. Descriptive statistics and correlations between participant responsiveness, providers’ characteristics, other implementation dimensions.
Table 4. Multilevel analysis of intuitive eating score by time and participants’ responsiveness.
Table 5. Multilevel analysis of body esteem (appearance subscale) score by time and participants’ responsiveness.
Supplemental material