
Figures & data
Table 1. Change in Health-Related Expectations and Behavior Between Time 1 and Time 2.
Figure 1. (a) Structural equations for food consumption. (b) Structural equations for physical activity. (c) Structural equations for number of drinks consumed per month. (d) Structural equations for binge drinking. Note. Standardized coefficients are shown. * p < .05, ** p < .01, *** p < .001.
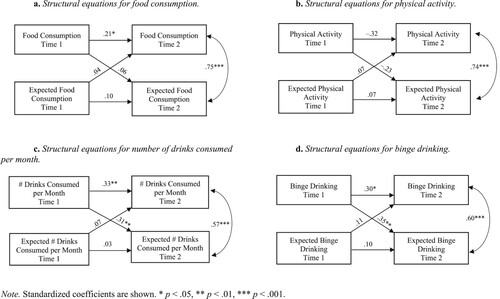
Table 2. Associations of coping with expectation disconfirmation with students’ change in expected health behavior (regression analysis).
Table 3. Associations of social tie's efforts to motivate unhealthy behaviors with students’ change in current and expected health behavior (regression analysis).
Table 4. Associations of having moved out of the parental home with students’ change in current and expected health behavior (regression analysis).