
Figures & data
Table 1. African Youth Psychological Assessment (AYPA).
Table 2. Descriptive statistics of analytical sample (n = 350).
Table 3. Mean and standard deviations of measures.
Figure 1. Structural equation model of Risk and Protective Factors on Psychological Symptoms and Wellbeing.
Note: CFI = 0.926; SRMR = 0.045; RMSEA = 0.059; *p < 0.05, **p < 0.01, ***p < 0.001; Sex was included as a covariate.
A structural equation model is shown with the second-order latent factors, ‘Risk Factors’, comprised of physical neglect, emotional neglect, emotional abuse and stigma measurement paths, and the second-order latent factor, ‘Protective Factors’, comprised of self-esteem, total autonomy and community relationships measurement paths. Structural paths from each second-order latent factor to both ‘Wellbeing’ and ‘Psychopathology’ and displaying the path coefficients. Curved covariance paths between risk and protective factors and between wellbeing and psychopathology latent factors are displayed with covariance coefficients. The error terms of each measure comprising each latent factor are shown.
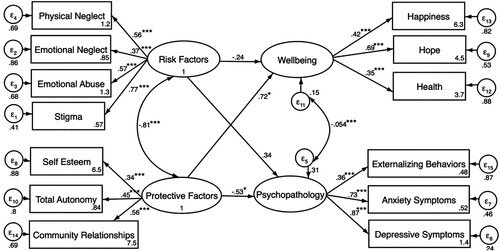
Table 4. Standardized path coefficients between risk and protective factors and mental health and wellbeing.