
Figures & data
Table 1. Means, standard deviations, ranges, and zero-order correlations between key variables.
Table 2. Hierarchical linear regression modelling self-reported monthly flossing frequency and using the global executive composite as a measure of general executive functioning.
Table 3. Comparison of hierarchical linear regressions modelling self-reported monthly flossing frequency using either the BRIEF-a behavioural regulation index or metacognition index to measure executive functioning.
Table 4. Direct (βD) and interaction (βI) coefficients of behavioural regulation index subscales from the behaviour rating inventory of executive function – adult version.
Figure 1. Effect of shifting (High Shift vs Low Shift) as a moderator of the relationship between intention and monthly flossing, with data split by behavioural prepotency (High BP vs Low BP).
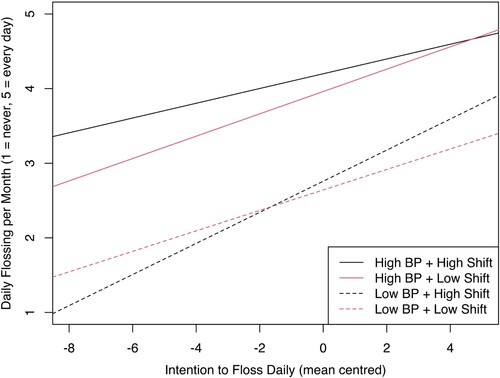
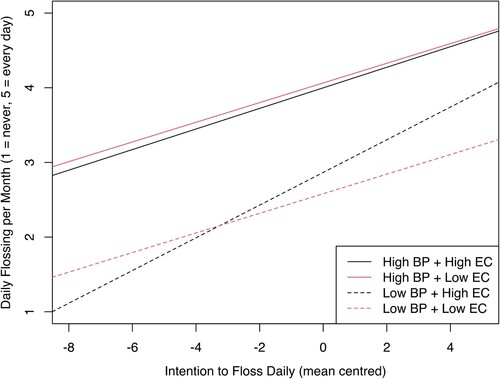
Figure 2. Effect of emotional control (High EC vs Low EC) as a moderator of the relationship between intention and monthly flossing, with data split by behavioural prepotency (High BP vs Low BP).
Supplemental Material
Download MS Word (153.4 KB)Data availability statement
The data that support the findings of this study are available from the corresponding author upon reasonable request.