
Figures & data
Table 1. Descriptive statistics and correlations for study variables.
Figure 1. Occurrence of stressors and perceived stress. Alternative stress: a list of the twenty stressful situations, sorted by the occurrence as a percentage, and associated bars showing the level of perceived stress per stressful situation.
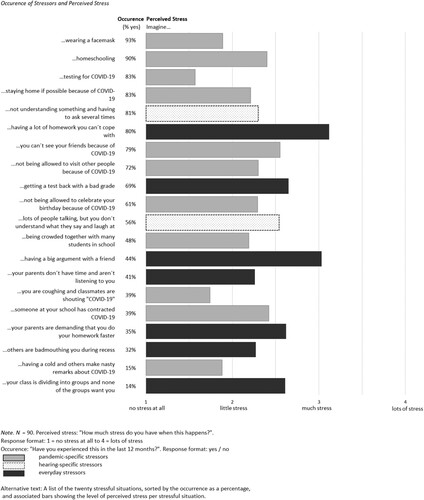
Table 2. Regression results for well-being with perceived stress and self-efficacy.
Table 3. Regression results for well-being with stressor occurrence and self-efficacy.