Figures & data
Figure 1. Hypothesized model of social environmental factors and adolescent risk behaviors.
Hypothesized SEM where parental monitoring and environmental risk have a reciprocal relationship and directly affect adolescents’ behavioral intentions and risk behaviors of delinquency, substance use, and sexual risk. Behavioral intentions also have a direct effect of risk behaviors.
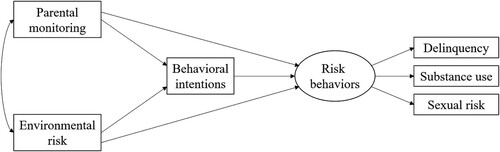
Table 1. Proportion of adolescents involved in delinquent, substance use, and sexual risk behaviors in Grade 6.
Table 2. Spearman correlation coefficients between age, parental monitoring, environmental risk, behavioral intentions, and adolescent risk behaviors (n = 2205).
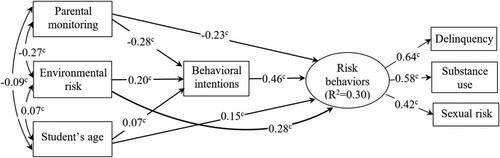
Figure 2. The relationships between parental monitoring, environmental risk, behavioral intentions, and adolescent risk behaviors. R2 = 0.57. cP < 0.001.
The final SEM where Parental monitoring, and students’ age have reciprocal relationships and directly affect adolescents’ behavioral intentions and risk behaviors of delinquency, substance use, and sexual risk. Behavioral intentions also have a direct effect of risk behaviors. All relationships are statistically significant.