
Figures & data
Figure 1. Flowchart of participants. cALL, childhood acute lymphoblastic leukemia.
Note. As all questionnaires were missing for these survivors and the frequency of missing data was low, we decided not to impute missing data.
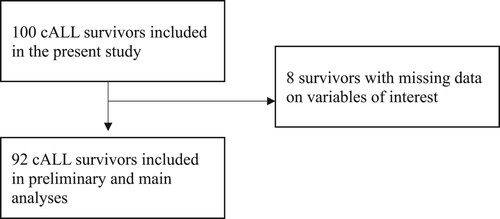
Figure 2. Frequencies of health function issues in 92 cALL survivors.
Note. cALL, childhood acute lymphoblastic leukemia. We used a count variable reflecting the number of health domains with at least a mild physical issue. A cut-point on the WHO-5 well-being index of > 50 for high-well being was used (Topp et al., Citation2015).
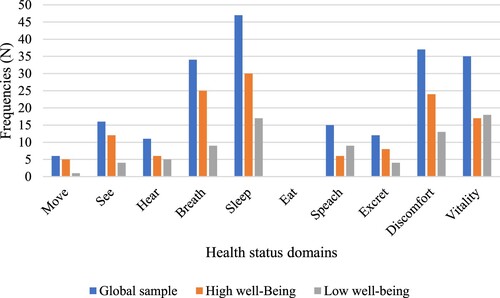
Table 1. Sociodemographic and clinical characteristics of 92 cALL survivors.
Table 2. Health status and psychosocial description of the study sample.
Table 3. Summary of logistic regression moderation analysis predicting the odds of belonging to the high well-being subgroup depending on emotional processing controlling for health status (n = 92).
Table 4. Summary of logistic regression moderation analysis predicting the odds of high well-being by expressive suppression, social support, and their interaction (n = 92).
Figure 3. Social support moderates the contribution of expressive suppression to well-being in a group of 92 cALL survivors.
Note. ERQ, Emotion Regulation Questionnaire. Models are adjusted for health status; As per the PROCESS output, Low social support = 11 people, Medium social support = 19 people, High social support = 30 people.
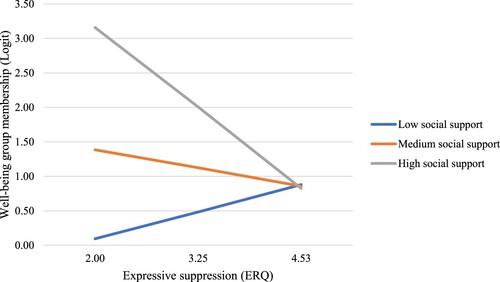
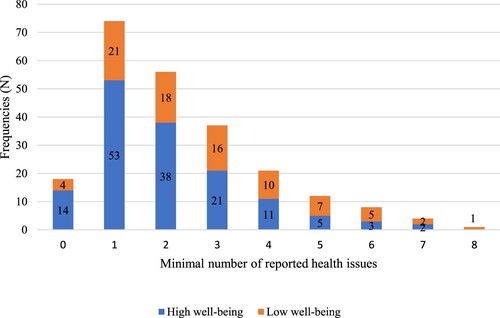
Figure 4. Number of health function issues reported by 92 cALL survivors on the 15D.
Note. cALL, childhood acute lymphoblastic leukemia. A cut-point on the WHO-5 well-being index of > 50 for high-well being was used (Topp et al., Citation2015).
Supplemental Material
Download Zip (49.5 KB)Data availability statement
The full dataset is available in Supplementary material attached to this article.