
Figures & data
Table 1. Situations and activities that participants reported avoiding due to their IBS symptoms.
Table 2. Means and standard deviations of included variables, as well as correlations between them.
Figure 1. Full mediation model including all variables under study. Solid lines indicate significant paths and dotted lines indicate insignificant paths.
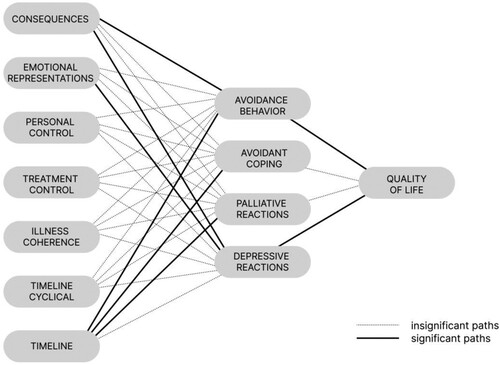
Figure 2. Simplified mediation analyses, which exclude variables not significantly related to quality of life. Models are presented separately for participants who reported seeking treatment for their IBS symptoms (Panel B), and for participants who did not report seeking treatment for their IBS symptoms (Panel A). Solid lines indicate significant indirect paths and dotted lines indicate insignificant indirect paths.
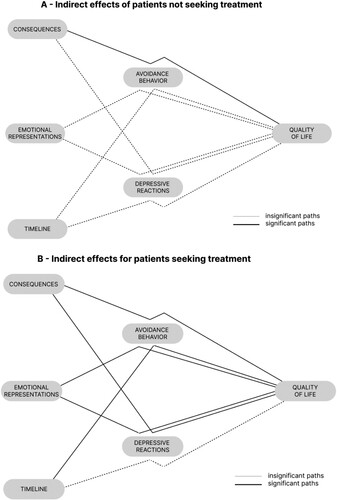
Table 3. Results of simplified moderated mediation models.
Supplemental Material
Download PDF (425.9 KB)Data availability statement
All data and syntax are available from the project’s Open Science Framework page (https://osf.io/cwkfq)