

Figures & data
Figure 1. Theoretical framework of the constructs.
A diagram with a white background and with outlined boxes connected with blue arrows. It illustrates that the construct (hope, meaning in life, religious or spiritual struggle) contributes to the quality of life, where the cancer stage moderates the association of hope and quality of life.
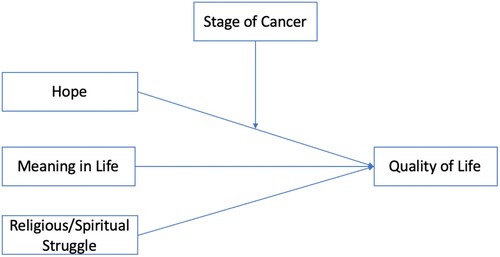
Table 1. Demographic characteristics of the participants (N = 300).
Table 2. Correlation of Hope, MIL, RSS and their dimensions with the QOL.
Table 3. Measurement model.
Table 4. Discriminant Validity of the first order constructs.
Table 5. Collinearity Assessment of the Second order constructs (predictors).
Figure 2. Path Model and Coefficient of Determination.
The diagram shows a network of connected nodes representing the dimension of the constructs, branching out to various blue nodes labeled as hope, meaning in life, religious or spiritual struggle, and the quality of life with a central green node labeled as moderation effect of the cancer stage.

Figure 3. t-statistics for the model.
The diagram consists of multiple blue circles and one central green circle. Each circle represents a different statistical term or value related to t-statistics. The circles are interconnected by lines, indicating relationships between these terms.
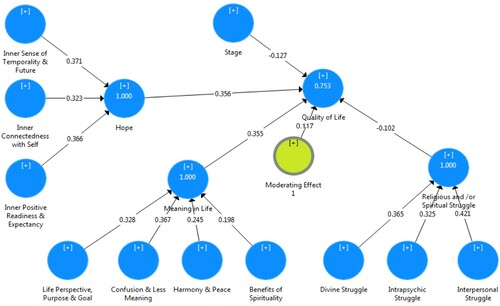
Table 6. Significance testing of the structural model’s path coefficient.
Figure 4. Predictive relevance of the model.
The figure highlights the predictive relevance of the three exogenous constructs (hope, meaning in life, and religious/spiritual struggle) for the endogenous construct (quality of life).
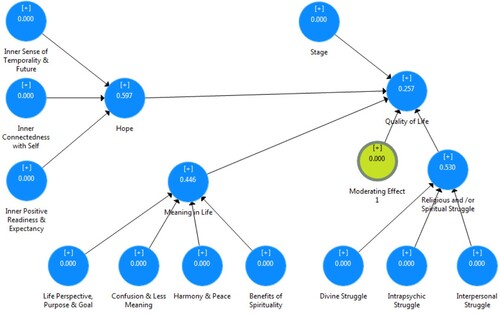
Table 7. Predictive relevance and effect size of the structural model.
Supplemental material