
Figures & data
Figure 1. Measurement points of the longitudinal study to evaluate the falls prevention program.
Note: BCTs = behavior change techniques, T1 = Time 1, T2 = Time 2.
A timeline shows the measurement points of the longitudinal study. On the left is the first visit to the falls prevention programs, where the behavior change techniques were observed. The timeline then shows the second visit, one week later, when questionnaires were distributed, and objective measures of coordination and gait speed were taken. The third visit is shown on the right side of the timeline with the reassessment of self-reports and objective measures. The figure shows that Time 1, including the first two visits, and Time T2 are six months apart.
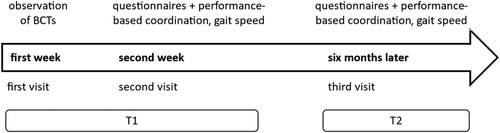
Figure 2. Framework for quantitative evaluation of outcomes.
The figure shows the objective and subjective outcomes and the three criteria of the evaluation framework. On the left is a box representing the following constructs of the physical functioning criterion: objectively measured gait speed and coordination (dual task), as well as subjective leg strength, balance, coordination, and habitual execution of the exercises. The fall-related variables criterion are shown in a box on the top right and are measured by number of falls and fear of falling. The lower right box shows the psychosocial functioning criterion with the constructs: quality of life, activities of daily living, mobility, and loneliness.
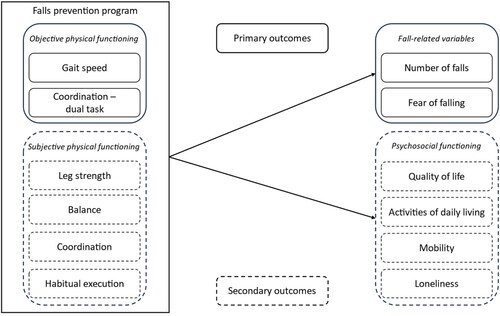
Table 1. Bivariate correlations in the longitudinal sample (n = 125).
Table 2. Effects on primary and secondary outcomes over 6 months.
Table 3. Identified behavior change techniques used by instructors across all observed falls prevention groups (n = 22).
Data availability statement
The data cannot be made available as the rights lie with the health insurance company.