Figures & data
Figure 1. Identification of cloning and recombinant expression plasmids. Lane M, DL2000 DNA marker. Lane 1, PCR amplification products of pET80L-ATB. Lane 2, pET80L-ATB digested by BamH I/Hind Ш.
Figure 2. Purification and Western blotting analysis of rATB protein. (A). SDS-PAGE analysis and purification of the rATB. Lanes 1 and 2, total cellular lysate of M15/pET80L-ATB induced without IPTG and with IPTG, respectively. Lanes 3 and 4, cell supernatants and cell debris after centrifugation at 12,000 rpm for 30 min. Lane 5, rATB eluted with elution buffer containing 500 mM imidazole. (B). Affinity chromatographic profile. (C). Western blotting analysis. Lane 1, pQE-80L vector-transformed cell lysates recognized by the rabbit pAb against AT. Lane 2, purified rATB recognized by the rabbit pAb against AT.
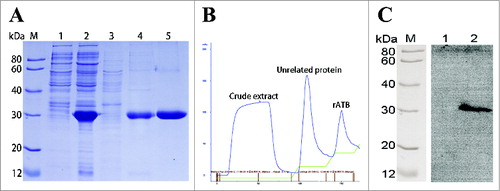
Figure 3. Vaccination with the rATB followed by different doses of AT administered by i.p. injection. (A). Average weights (as percentage of initial weight). (B). Survival curves. n = 4 groups of 5 mice = 20.
Table 1. The anti-rATB IgG antibody titers of sera after each immunization and challenge trial
Figure 4. The rATB neutralization assay and efficacy of passive protection. (A). Average weights (as percentage of initial weight). (B). Survival curves. n = 4 groups of 5 mice = 20.
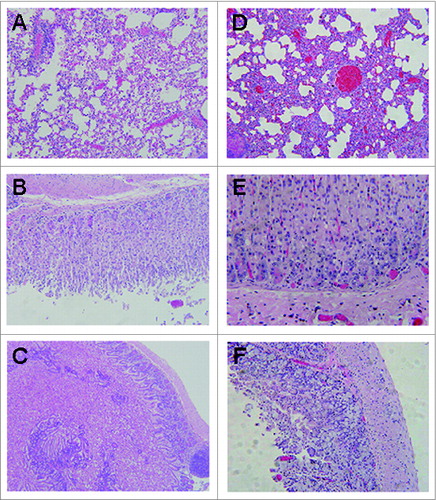
Figure 5. Histopathologic examination in BALB/c mice post-challenge with AT (HE stain, 100×). (A). mice vaccinated with rATB showing mild inflammatory cells and alveoli fibrosis in the lung. (B). mice vaccinated with rATB showing normal stomach. (C). mice vaccinated with rATB showing villi slightly shortened and rare necrotic epithelial cells in the intestine. (D). mice vaccinated with PBS showing severe inflammatory infiltrates and alveoli extension in the lung. (E). mice vaccinated with PBS showing numerous apoptotic cells in the stomach. (F). mice vaccinated with PBS showing numerous apoptotic and necrotic cells in the intestine.