Figures & data
Table 1. Characteristics of studies included in the meta-analysis
Figure 1. Data identification and acquisition.
Table 2. Differentially expressed up-regulated genes within 7d after vaccination using meta-analysis
Table 3. Differentially expressed down-regulated genes within 7d after vaccination using meta-analysis
Table 4. The pathway distribution of DEGs within 7d after vaccination
Figure 2. Number of DEGs with upregulation on days 3 and 7 after vaccination. Note:There were 36 upregulated genes in 3 days, including 32 specific genes and there were 20 up-regulated genes in 7 days, including 16 specific genes. Four genes were commonly upregulated between days 3 and 7 after vaccination, among them 2 were type I IFN related genes.
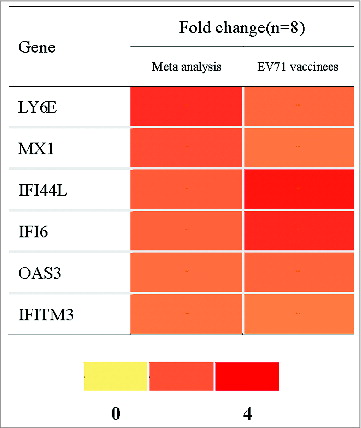
Figure 3. The meta-analysis and EV71 vaccinated group validation results of 6 type I IFN related genes. Note: PBMC for baseline and day 3 after the vaccination from 8 EV71 vaccinees were assayed by RT-PCR. FC of each gene was the arithmetic average of the expression of 3 day post-vaccination/ 0 day pre-vaccination. FC greater than 1.5 is shown in red in the figure.