
Figures & data
Figure 1. Morphology of the Walvax-2 cells. The cells were cultured and incubated at 37 °C. The photos were taken at 4 h (A), 24 h (B) and 48 h (C) and at 72 h post-subculture for the 58th passage (D).
Table 1. Population doubling times of the Walvax-2 cells with and without being subjected to freezing
Figure 2. The growth patterns of Walvax-2 cell banks. Primary cells were isolated from fetal lung tissue, frozen at the 6th, 14th and 20th passages, and then recovered and subcultured continuously until cell senescence occurred.
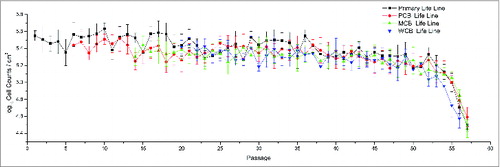
Figure 3. Isoenzyme tests for the Walvax-2 cells. Firstly, LD and G6PD, 2 isoenzymes used as indicators, were isolated from HeLa, L929, MRC-5 and Walvax-2 cells, and then subjected to PAGE and stained. The numbers of 20090327, 20090514 and 20090724 illustrated in the pictures represent Walvax-2 cells for the 18th, 30th and 50th passages.
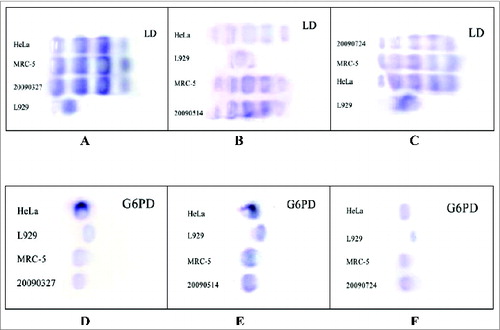
Table 2. The STR mapping of the Walvax-2 cells
Figure 4. The Short Tandem Repeat (STR) map of Walvax-2 cells for the 18th passage. According to the instructions supplied with the Goldeneye 16A identification kit (people spot), the DNA of Walvax-2 cells at the 18th passage were isolated and amplified by multiplex PCR with primers of 16 STR sites. Then the STR map was obtained by analyzing the samples of PCR by capillary electrophoresis (CE). The STR maps of Walvax-2 cells at the 30th and 50th passages (not shown) were the same as shown.
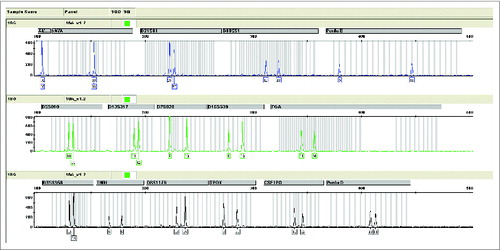
Table 3. The accumulated results of chromosomal analysis of Walvax-2 cells
Figure 5. Chromosomes from Walvax-2 cell banks. Walvax-2 cells were incubated 1 day post-subculture, after which the colcemid and then Giemsa banded karyotype analyses were carried out. Pictures were the karyotype of Walvax-2 cells at the 6th (A), 14th (B), 20th (C) and 38th (D) passages
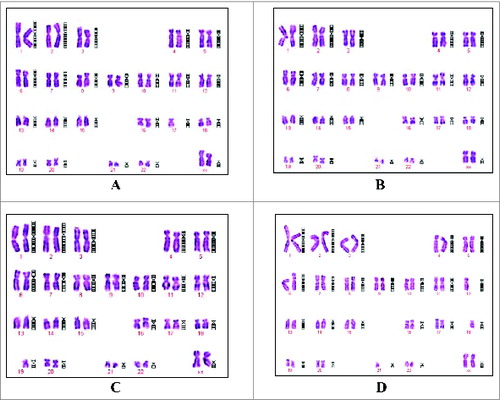
Figure 6. Retrovirus tests of Walvax-2. The results were observed by mirror electron microscopy(200Kv 5000x/160Kv 7800x). The arrows point to virus particles detected as shown in the picture. (A) and (A-1) were represented positive controls (Sp2/0-Ag14), (A-1) was partial enlarged detail of (A). (B) was represented negative control (MRC-5). (C) was represented the cells of Walvax-2 of the 24th passage.
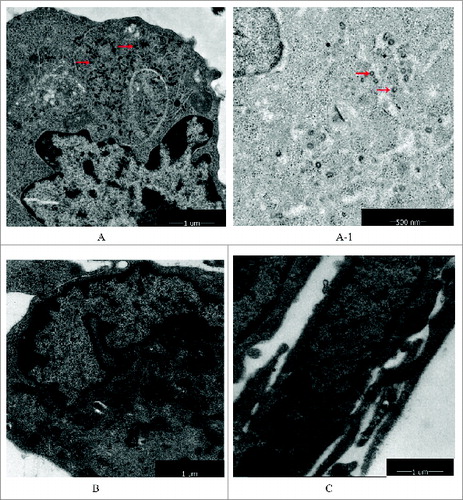
Table 4. Propagation of CTN-1V or PM virus in the Walvax-2 or MRC-5 cells
Table 5. Propagation of VZV strain in the Walvax-2 or MRC-5 cells
Table 6. The titers of HAV (YN5) adapted in human diploid cells