Figures & data
Table 1. The plasma levels of anti-CII antibodies from vaccinated normal rats with pcDNA-CCOL2A1 vaccine at different time-points after a single intramuscular injection of therapeutic dosage of 300 ug/kg (Units/mL, n = 30).
Table 2. The plasma concentrations of inflammatory and anti-inflammatory cytokines from vaccinnated normal rats with pcDNA-CCOL2A1 vaccine at different time-points after a single intramuscular injection of therapeutic dosage of 300μg/kg(pg/mL, n = 30).
Table 3. The plasma concentrations of inflammatory and anti-inflammatory cytokines from vaccinnated normal rats with pcDNA-CCOL2A1 vaccine on the 14th day after a single intramuscular injection of maximum dosage of 3 mg/kg (pg/mL, n = 6).
Figure 1. (See previous page). The cellular immune response to the pcDNA3.1-CCOL2A1 vaccine(300 μg/kg) in normal rats. (A) The percentages of peripheral blood Tc, Ts, CD4+CD29+, CD4+CD25+Treg, Th1/Th2, and Th17 cells in vaccinated and unvaccinated normal rats. Rats were administered a single dose of 300 μg/kg pcDNA3.1-CCOL2A1 vaccine, and immune system cells were analyzed 3 to 5 d after injection. *P < 0.05 versus normal control (NC) using t-tests. (B) Representative data from flow cytometry analysis of peripheral blood CD4+CD25+Treg, CD4+CD29+, Th1/Th17,Th2, and Tc/Ts cells from vaccinated and unvaccinated normal rats 3 to 35 d after a single intramuscular injection of 300 μg/kg pcDNA3.1-CCOL2A1. The left diagram in each group shows the representative isotype-matched control and the corresponding analyzed T-lymphocyte subsets on the right diagram. These data are representative of 3 experiments. Three separate experiments yielded similar results.
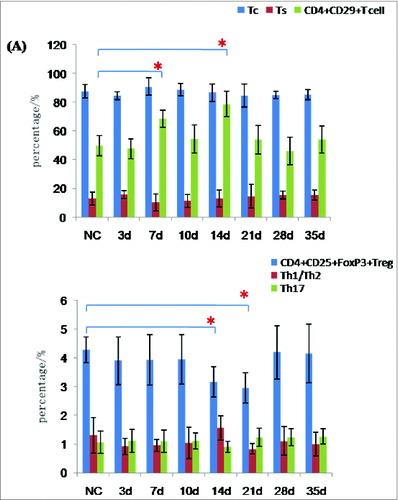
Figure 1. (Continued)
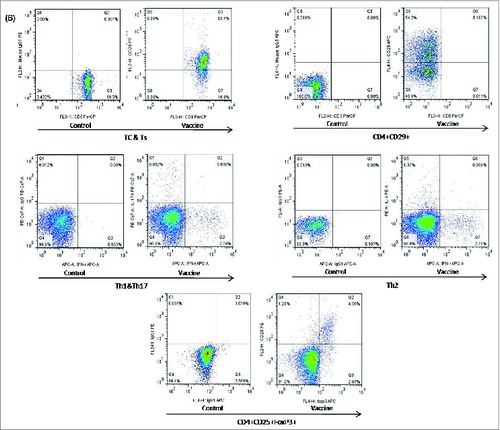
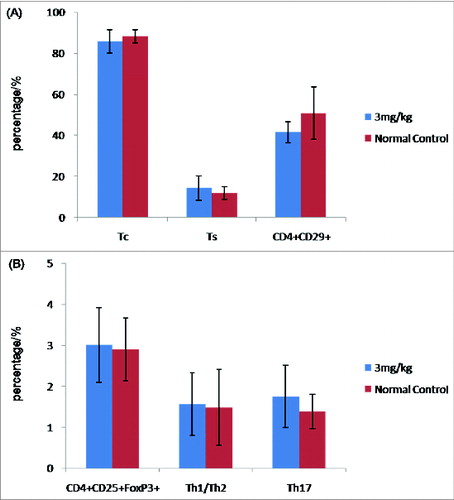
Figure 2. Cellular immune response to 3 mg/kg pcDNA3.1-CCOL2A1 vaccine in normal rats. (A) The percentages of peripheral blood Tc,Ts, and CD4+CD29+T cells in vaccinated and unvaccinated rats on day 14 after a single intramuscular injection of the vaccine. (B) The percentages of peripheral blood CD4+CD25+FoxP3+Treg, Th1/Th2, and Th17 cells from vaccinated and unvaccinated normal rats on day 14 after a single intramuscular injection of the vaccine. These data are representative of 3 experiments. Three separate experiments yielded similar results.