Figures & data
Figure 1. Cloning of the porA gene from N. meningitidis B15 P1.3 in the plasmid pET21a. A. PorA gene PCR amplification. The fragments were separated on a 1% agarose gel and stained with ethidium bromide. Lane 1 = λ/Hind III-digested molecular weight DNA standard. Lane 2 = PCR control reaction with a single PorA-1F primer. Lane 3 = control reaction with PorA-1R primer. Lane 4 = reaction with both primers and N. meningitidis chromosome as template. Lane 5 = λ/Bst II-digested DNA molecular weight standard (Gene Craft). B. Cloning of the amplified products by ligation to the pET21a plasmid. Lane 1 = λ/Bst II-digested DNA molecular weight standard. Lane 2 = pET21a-porA plasmid DNA without digestion. Lane 3 = pET21a-porA plasmid DNA under double digestion with Nde I and Hind III.
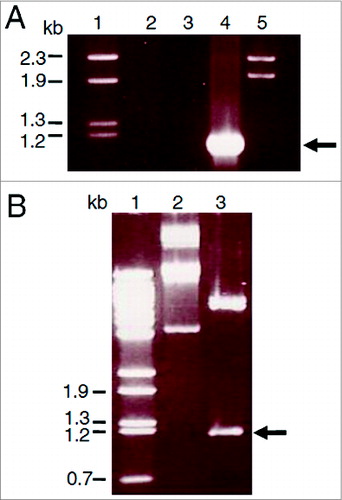
Figure 2. Purification of PorA recombinant protein from E. coli BL21 (DE3) culture using Ni-NTA column chromatography. A. Analysis of fractions by 10% SDS-PAGE. Lane 1 = Mark12TM unstained protein standard (Invitrogen). Lane 2 = total bacterial extract before purification. Lanes 3 to 10 = 2 ml fractions of purified rPorA eluted from a Ni-NTA column under denaturing conditions (8 M urea), as described in the methods section. B. Western Blot of the same purified rPorA fractions. Lane 1 = PageRulerTM Prestained Protein (Fermentas). Lane 2 = Total bacterial extract before purification. Lanes 3 to 10 = Fractions of purified rPorA.
Figure 3. Anti-PorA antibodies responses to oral immunization in BALB/c mice using different rPorA formulations: PorA formulations rPorA 5 y 10 μg, AbISCO-PorA 5 y 10 μg. Immunization was evaluated in 8 groups of mice as described in the materials and methods section. The ELISA was performed as described in the materials and methods section.
Figure 4. Anti-PorA specific responses of IgG1 and IgG2a antibodies to immunization with different rPorA formulations. (A). Antibodies anti-IgG1 in different immunized group formulations: AbISCO-PorA 5 and 10 μg and rPorA 5 and 10 μg alone. The immunization was evaluated in 8 groups of mice, as described in the material and methods section. ELISA was performed as described in the materials and methods section. (B). Antibodies anti-IgG2a in different immunized group formulations with 5 and 10 μg of the recombinant protein AbISCO-PorA and 5 and 10 μg rPorA alone. ELISA was performed as described in the methods section. All values were expressed in relative units.
Figure 5. Secretion of interleukin from splenocytes in response to stimulation with rPorA in different experimental groups. (A). ELISA: IL-4 secretion in splenocytes stimulated with 5 μg of rPorA. (B). ELISA: IFN-γ secretion in splenocytes stimulated with 5 μg of rPorA. A significant increase in IL-4 secretion in the experimental group immunized with 5 μg of PorA protein was observed (P < .05).
Table 2. Sequences of primers used in this work
Table 1. SBA titers of mice immunized with rPorA or rPorA + AbISCO*
Figure 6. Humoral response of IgG anti-HpaA in mice after oral immunization with Lactococcus lactis strain expressing a PorA-HpaA hybrid driven by nisin-inducible promoter in the pSEC plasmid. Antibodies (as arbitrary units) were determined through ELISA using purified HpaA antigen bound to the plate wells. Five groups of 7 mice each were immunized with PBS, L. lactis carrying only the pSEC vector, L. lactis expressing H. pylori HpaA antigen, the PorA351-HpaA hybrid and the PorA222-HpaA hybrid. The antibodies were evaluated at different stages during the immunization protocol: PI = previous to primary immunization; PB = previous to boosting (week 3), PC = previous to challenge (week 6) and PS = previous to sacrifice (week 9). The PtdIns values were subtracted from the other samples. (*) P < 0.05 and (***) P < 0.001.
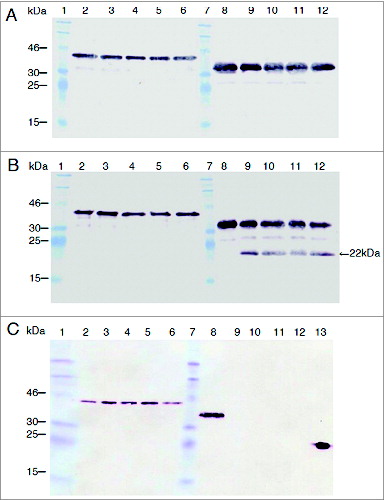
Figure 7. PorA resistance to protease digestion compared with that of PorB. In vitro incubations were performed with pepsin (A), trypsin (B) and chymotrypsin (C) in the final volume of 300 μl. Twenty-five microliter of rPorA at 0, 4, 8, 12 and 16 min (lanes 2 to 6) and PorB (same times, lanes 8 to 12) were collected and analyzed through SDS-PAGE and Western blotting using His-tagged PorA and PorB proteins. The protease/substrate ratio were 1.2/1 (pepsin), 1/20 (trypsin) and 1/50 (chymotrypsin). The active enzyme added was approximately 0.3 units per assay. The MW for rPorA and rPorB were 42 kDa and 38 kDa, respectively. A single 22 kDa trypsin degradation product was observed for PorB (panel B, lanes 9-12) but none for PorA. PorB was degraded early and completely by chymotrypsin (panel C, lanes 9-12). The relevant bands of Prestained protein standard (Fermentas) are indicated. A positive control reaction (3 ng of His-tagged VP2 protein from the Infectious Pancreatic Necrosis Virus) was included (panel C, lane 13).