Figures & data
Table 1. Baseline (Day 0) Measures of Immune Response in the 106 Subjects by Sex, Age, and Race
Figure 1. Algorithm of HI Results across the 106 Subjects by the Changes in Days 0, 28, and 75.
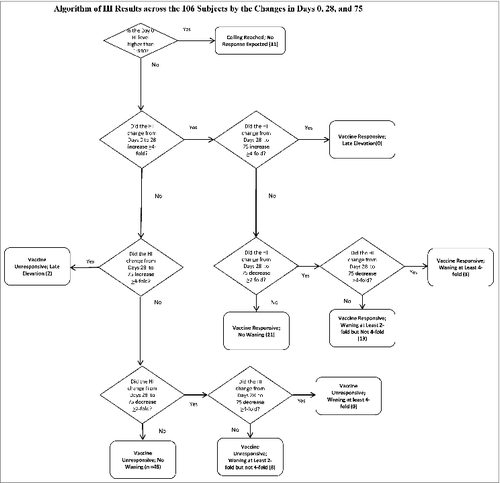
Table 2. Distribution of the 106 Subjects by Changes at Days 0, 28, and 75
Figure 2. Behavior of HI Titers across the 106 Subjects over Days 0, 28, and 75.
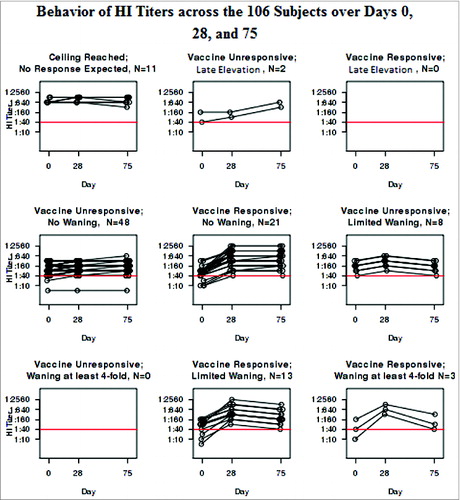
Table 3. Distribution of the Hemagglutination-Inhibition Assay, Viral Neutralization Assay and B-cell ELISPOT Results
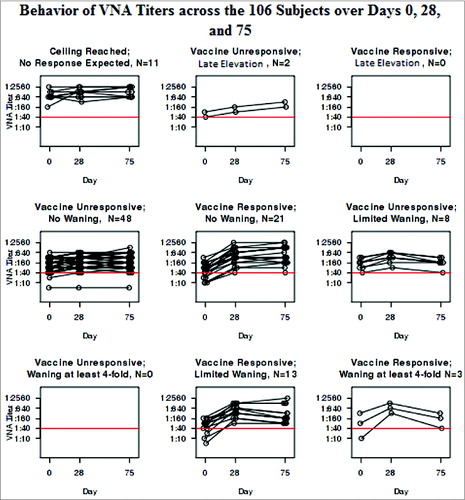
Figure 3. Behavior of VNA Titers across the 106 Subjects over Days 0, 28, and 75.