
Figures & data
Figure 1. Schematic of the Design of the H5N1 COBRA HA proteins. A phylogenetic tree was inferred from hemagglutinin amino acid sequences using the maximum likelihood method and clade/sub-clade groupings were identified. The first generation, human COBRA-2 (upper left) was designed using sequences identified in clade 2 from human infections (between 2005-2007) and has previously been described (Giles et al. 2010. Vaccine). Primary consensus sequences were generated for each outbreak group. Secondary consensus sequences were then generated for each subclade using the primary sequences as inputs. The secondary consensus sequences were then aligned and the resulting consensus, designated COBRA, was generated. The second generation of H5N1 COBRA HA proteins were designed using clade 2 isolates from both human and avian infections (upper right) and using all HA H5N1 sequences from all clades (2005-2010) in the NCBI and GASIAD databases.
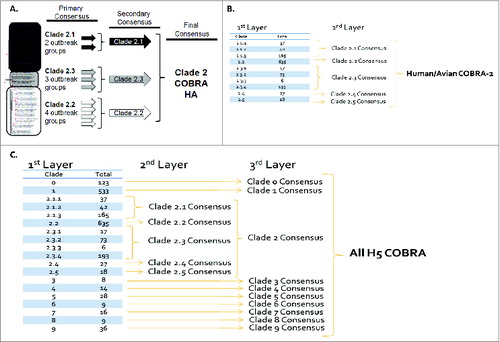
Figure 2. Schematic of 3 dimensional structure of trimerized H5N1 COBRA HA proteins. (A) Predicted structural model of the H5N1 COBRA HA sequences. HA sequences were downloaded encoded NCBI GenBank and GISAID to develop the COBRA HA sequences. Each COBRA HA structure presented was generated using the 3D-JIGSAW algorithm based onCitation33 and renderings were performed using MacPyMol. (B) Amino acid positions in major HA antigenic sites that differ between the 3 COBRA H5N1 HA sequences.
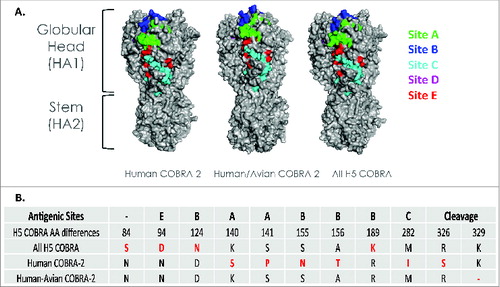
Figure 3. Phylogenetic diversity of H5N1 influenza. The unrooted phylogenetic tree was inferred from HA amino acid sequences derived from 28 representative isolates in various clades and subclades and also the COBRA HA using the maximum likelihood method. Clade/subclade clusters are identified on the right. Sequences were aligned with MUSCLE 3.7 software and the alignment was refined by Gblocks 0.91 b software. Phylogeny was determined using the maximum likelihood method with PhyML software. Trees were rendered using TreeDyn 198.3 software.Citation42 The NCBI accession numbers for the HA sequences used in phylogeny inference were obtained through the Influenza Virus Resource.Citation43
Figure 4. Highly pathogenic H5N1 influenza virus challenge of mice. BALB/c mice (5 mice/group) vaccinated at weeks 0 and 4 with each vaccine plus alum adjuvant were infected with 5 × 10e+6 PFU of the highly pathogenic clade 2.1 H5N1 virus A/Whooperswan/Mongolia/244/2005 (WS/05) or the clade 1 H5N1 virus A/Vietnam/1203/2004 (VN/04). Mice were monitored daily for weight loss (A and C) and viral lung titers on selected mice on day 3 post-infection (B and D). Statistical significance of the antibody titer data was determined using 2-way analysis of variance followed by the Bonferroni posttest to analyze differences between each vaccine group for each of the different antigens that were tested (multiparametric). Significance was defined as P < 0.05. Statistical analyses were performed with GraphPad Prism software.
Figure 5. Viral lung titers in mice vaccinated with a single vaccination. BALB/c mice (5 mice/group) vaccinated one time with a 3μg dose with each vaccine plus alum adjuvant and then were infected with 5 × 10e+6 PFU with the clade 1 H5N1 virus A/Vietnam/1203/2004 (VN/04). Mice were monitored daily for weight loss (data not shown) and viral lung titers from selected mice on day 2 and 3 post-infection. Statistical significance of the antibody titer data was determined using 2-way analysis of variance followed by the Bonferroni posttest to analyze differences between each vaccine group for each of the different antigens that were tested (multiparametric). Significance was defined as P < 0.05. Statistical analyses were performed with GraphPad Prism software.
Figure 6. Highly pathogenic H5N1 influenza virus challenge of mice. BALB/c mice (5 mice/group) vaccinated one time with a 0.6 ug dose with each vaccine plus alum adjuvant were infected with 5 × 10e + 6 PFU of WS/05 or VN/04. Mice were monitored daily for weight loss (A and B) and viral lung titers from selected mice on day 3 post-infection (C and D). Statistical significance of the antibody titer data was determined using 2-way analysis of variance followed by the Bonferroni posttest to analyze differences between each vaccine group for each of the different antigens that were tested (multiparametric). Significance was defined as P < 0.05. Statistical analyses were performed with GraphPad Prism software.
Table 1. HAI serum antibody titers from vaccinated mice against a panel of H5N1 isolates
Table 2. Amino acid differences identified in the 5 antigenic sites on the H5N1 HA proteins