695
Views
8
CrossRef citations to date
0
Altmetric
Research Papers

MC32 tumor cells acquire Ag-specific CTL resistance through the loss of CEA in a colon cancer model

&
Pages 2012-2020 | Received 10 Nov 2014, Accepted 25 Jan 2015, Published online: 11 Aug 2015

Figures & data

Figure 1. Selection of MC32-S2–1 and MC32-S4–1 cells showing tumor growth in mice immunized with CEA DNA vaccines. (A) Each group of mice (n = 6–8/group) was immunized by IM-EP with 50 μg of CEA DNA vaccines (pCEA) per mouse at 0 and 1 weeks. The animals were also injected intraperitoneally with 50 μg of anti-4–1BB Abs at 0 and 1 weeks. At 3 weeks, the mice were challenged s.c. with 1 × 10⁵ MC32 cells per mouse. Tumor sizes were measured and recorded at 41 d following tumor cell challenge. In the group immunized with pcDNA3+anti-4–1BB Abs, one mouse showing no tumor formation was not included in the tumor size calculation to reduce variation. The values and bars represent mean tumor sizes and the SD, respectively. The numbers in (/) denote the number of mice showing no tumor formation at 50 d post-tumor cell challenge/the number of mice tested. Of the 8 mice challenged with MC32 cells following immunization with pCEA+anti-4–1BB Abs, 4 tumor-forming mice were sacrificed. Tumor tissues were surgically removed and then expanded more than 5 times in cDMEM. The resultant 4 tumor cells were designated as MC32-S1, MC32-S2, MC32-S3 and MC32-S4. Of the 8 mice challenged with MC32 cells following immunization with pCEA+anti-4–1BB Abs, 4 tumor-free mice were re-immunized with pCEA at 60 d post-tumor cell challenge. At 7 d following final immunization, each of the mice (F–I) was re-challenged with 5 × 10⁵ MC32 cells per mouse on the right flank and with 5 × 10⁵ MC32-S1 (F), MC32-S2 (G), MC32-S3 (H), or MC32-S4 (I) cells per mouse on the left flank. Each of the control mice was also challenged with 5 × 10⁵ MC32 cells per mouse on the right flank and with 5 × 10⁵ MC32-S1 (B), MC32-S2 (C), MC32-S3 (D) or MC32-S4 (E) cells per mouse on the left flank. Tumor sizes were measured at each time point, and each tumor volume was recorded. *P < 0.05 using ANOVA compared with pcDNA3.
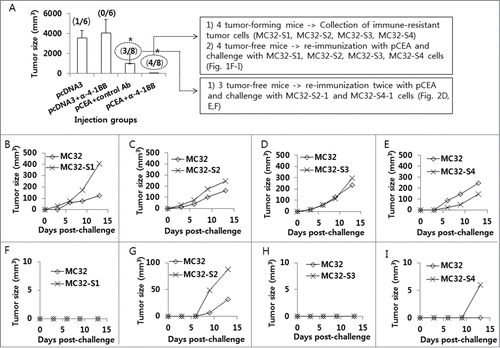
Figure 1. Selection of MC32-S2–1 and MC32-S4–1 cells showing tumor growth in mice immunized with CEA DNA vaccines. (A) Each group of mice (n = 6–8/group) was immunized by IM-EP with 50 μg of CEA DNA vaccines (pCEA) per mouse at 0 and 1 weeks. The animals were also injected intraperitoneally with 50 μg of anti-4–1BB Abs at 0 and 1 weeks. At 3 weeks, the mice were challenged s.c. with 1 × 10⁵ MC32 cells per mouse. Tumor sizes were measured and recorded at 41 d following tumor cell challenge. In the group immunized with pcDNA3+anti-4–1BB Abs, one mouse showing no tumor formation was not included in the tumor size calculation to reduce variation. The values and bars represent mean tumor sizes and the SD, respectively. The numbers in (/) denote the number of mice showing no tumor formation at 50 d post-tumor cell challenge/the number of mice tested. Of the 8 mice challenged with MC32 cells following immunization with pCEA+anti-4–1BB Abs, 4 tumor-forming mice were sacrificed. Tumor tissues were surgically removed and then expanded more than 5 times in cDMEM. The resultant 4 tumor cells were designated as MC32-S1, MC32-S2, MC32-S3 and MC32-S4. Of the 8 mice challenged with MC32 cells following immunization with pCEA+anti-4–1BB Abs, 4 tumor-free mice were re-immunized with pCEA at 60 d post-tumor cell challenge. At 7 d following final immunization, each of the mice (F–I) was re-challenged with 5 × 10⁵ MC32 cells per mouse on the right flank and with 5 × 10⁵ MC32-S1 (F), MC32-S2 (G), MC32-S3 (H), or MC32-S4 (I) cells per mouse on the left flank. Each of the control mice was also challenged with 5 × 10⁵ MC32 cells per mouse on the right flank and with 5 × 10⁵ MC32-S1 (B), MC32-S2 (C), MC32-S3 (D) or MC32-S4 (E) cells per mouse on the left flank. Tumor sizes were measured at each time point, and each tumor volume was recorded. *P < 0.05 using ANOVA compared with pcDNA3.

Figure 2. Selection of MC32-S2–2 and MC32-S4–2 cells with resistance to CEA DNA immunization. (A–F) Of the 8 mice challenged with MC32 cells following immunization with pCEA+control Abs (of ), 3 tumor-free mice were re-immunized with pCEA at 60 and 106 d post-tumor cell challenge. At 3 weeks following the final re-immunization, each of the 3 mice (D–F) was re-challenged with 5 × 10⁵ MC32 (on the upper right flank), MC-32-S2–1 (on the lower right flank) or MC-32-S4–1 (on the upper left flank) cells per mouse, in parallel with naïve control mice (A–C). Tumor sizes were measured at each time point, and each tumor volume was recorded.
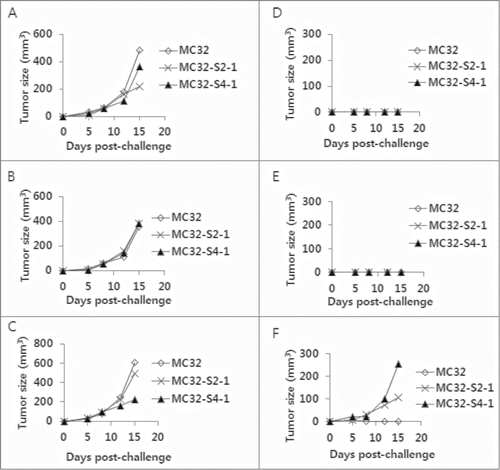
Figure 2. Selection of MC32-S2–2 and MC32-S4–2 cells with resistance to CEA DNA immunization. (A–F) Of the 8 mice challenged with MC32 cells following immunization with pCEA+control Abs (of Fig. 1A), 3 tumor-free mice were re-immunized with pCEA at 60 and 106 d post-tumor cell challenge. At 3 weeks following the final re-immunization, each of the 3 mice (D–F) was re-challenged with 5 × 10⁵ MC32 (on the upper right flank), MC-32-S2–1 (on the lower right flank) or MC-32-S4–1 (on the upper left flank) cells per mouse, in parallel with naïve control mice (A–C). Tumor sizes were measured at each time point, and each tumor volume was recorded.

Figure 3. The sensitivity of MC32-S2–2 and MC32-S4–2 cells to CEA-specific CTL-mediated apoptosis in vitro and their ability to stimulate CEA-specific immune cells in vitro. (A) Naïve mice were immunized by IM-EP with 50 μg of CEA DNA vaccines (pCEA) per mouse at 0, 1 and 2 weeks. The mice were sacrificed at 4 weeks, and the spleens were removed for immune cell isolation. The cells were stimulated in vitro with CEA class I peptides and rIL-2 and then reacted with MC32, MC32-S2–2 and MC32-S4–2 cells for in vitro CTL lytic assay, as described in the Materials and Methods. (B) Similar experiments in , except that 6 × 10⁶ immune cells were stimulated for 2 d with 2 × 10⁶ MC38, MC32, MC32-S2–2 and MC32-S4–2 cells, which had been exposed to UV light for 3 h before immune cell stimulation. Cell supernatants were used for sandwich ELISA to measure IFN-γ. *P < 0.05 using ANOVA compared with MC38.
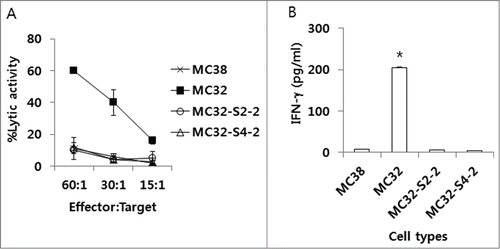
Figure 3. The sensitivity of MC32-S2–2 and MC32-S4–2 cells to CEA-specific CTL-mediated apoptosis in vitro and their ability to stimulate CEA-specific immune cells in vitro. (A) Naïve mice were immunized by IM-EP with 50 μg of CEA DNA vaccines (pCEA) per mouse at 0, 1 and 2 weeks. The mice were sacrificed at 4 weeks, and the spleens were removed for immune cell isolation. The cells were stimulated in vitro with CEA class I peptides and rIL-2 and then reacted with MC32, MC32-S2–2 and MC32-S4–2 cells for in vitro CTL lytic assay, as described in the Materials and Methods. (B) Similar experiments in Fig. 3A, except that 6 × 10⁶ immune cells were stimulated for 2 d with 2 × 10⁶ MC38, MC32, MC32-S2–2 and MC32-S4–2 cells, which had been exposed to UV light for 3 h before immune cell stimulation. Cell supernatants were used for sandwich ELISA to measure IFN-γ. *P < 0.05 using ANOVA compared with MC38.

Figure 4. Expression of an MHC class I molecule in MC32-S2–2 and MC32-S4–2 cells and the presence of human CEA in these cells. (A) MC32, MC32-S2–2 and MC32-S4–2 cells were trypsin-treated and then reacted with anti-H-2Kb-FITC. The cells were subsequently analyzed using a flow cytometer. Thin line, cells reacted with FITC-conjugated control Abs; thick line, cells reacted with anti-H-2Kb-FITC. (B) MC38, MC32, MC32-S2–2 and MC32-S4–2 cells were grown in cDMEM. The cells were lysed in RIPA buffer, and 30 μg samples of cell lysates were separated by SDS-PAGE and analyzed by Western blot assay, as described in the Materials and Methods. (C) MC38, MC32, MC32-S2–2 and MC32-S4–2 cells were lysed for genomic DNA purification. Four hundred ng of genomic DNA was tested for PCR assay against human CEA, as described in the Materials and Methods.
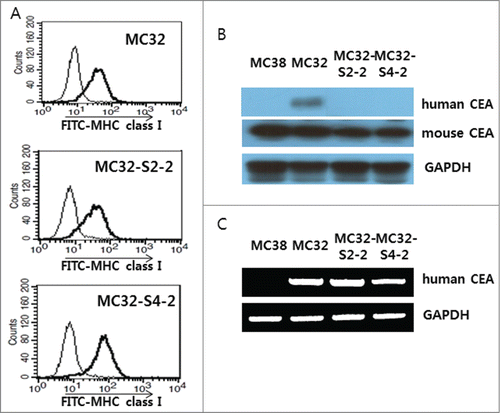
Figure 4. Expression of an MHC class I molecule in MC32-S2–2 and MC32-S4–2 cells and the presence of human CEA in these cells. (A) MC32, MC32-S2–2 and MC32-S4–2 cells were trypsin-treated and then reacted with anti-H-2Kb-FITC. The cells were subsequently analyzed using a flow cytometer. Thin line, cells reacted with FITC-conjugated control Abs; thick line, cells reacted with anti-H-2Kb-FITC. (B) MC38, MC32, MC32-S2–2 and MC32-S4–2 cells were grown in cDMEM. The cells were lysed in RIPA buffer, and 30 μg samples of cell lysates were separated by SDS-PAGE and analyzed by Western blot assay, as described in the Materials and Methods. (C) MC38, MC32, MC32-S2–2 and MC32-S4–2 cells were lysed for genomic DNA purification. Four hundred ng of genomic DNA was tested for PCR assay against human CEA, as described in the Materials and Methods.

Figure 5. The levels of antitumor protective responses and Ag-specific CTL lytic activity in CEA DNA-immunized mice following a challenge with MC32, MC32-S2–2 and MC32-S4–2 cells. (A) Each group of mice (n=5/group) was immunized by IM-EP with 50 μg of CEA DNA vaccines (pCEA) per mouse at 0 and 1 weeks. At 3 weeks, the animals were challenged s.c. with 1 × 10⁵ MC32, MC32-S2–2 and MC32-S4–2 cells per mouse, along with control mice injected with pcDNA3. Tumor sizes were measured at 13 d post-challenge, and mean tumor volumes were recorded. The values and bars represent mean tumor sizes and the SD, respectively. (B–G) The mice were subsequently tested for the levels of in vivo CTL lytic activity (B, control mice challenged with MC32 cells; C, control mice challenged with MC32-S2–2 cells; D, control mice challenged with MC32-S4–2 cells; E, pCEA-immunized mice challenged with MC32 cells; F, pCEA-immunized mice challenged with MC32-S2–2 cells; G, pCEA-immunized mice challenged with MC32-S4–2 cells) at 13 d post-challenge. For this experiment, CEA peptide-pulsed (CFSE high) and un-pulsed (CFSE low) splenocytes were injected i.v. into the immunized mice, as described in the Materials and Methods. After 20 h, the mice were sacrificed and the splenocytes were analyzed by FACS to measure the levels of CFSE-labeled cells in each subset. M1, un-pulsed CFSE low population; M2, CEA-pulsed CFSE high population. (H) %lytic activity of the tested groups. The values and bars represent mean CTL activity and the SD, respectively. *P < 0.05 using the independent sample's t test compared with MC32 or pcDNA3.
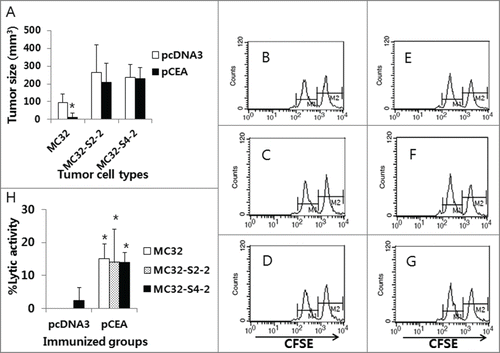
Figure 5. The levels of antitumor protective responses and Ag-specific CTL lytic activity in CEA DNA-immunized mice following a challenge with MC32, MC32-S2–2 and MC32-S4–2 cells. (A) Each group of mice (n=5/group) was immunized by IM-EP with 50 μg of CEA DNA vaccines (pCEA) per mouse at 0 and 1 weeks. At 3 weeks, the animals were challenged s.c. with 1 × 10⁵ MC32, MC32-S2–2 and MC32-S4–2 cells per mouse, along with control mice injected with pcDNA3. Tumor sizes were measured at 13 d post-challenge, and mean tumor volumes were recorded. The values and bars represent mean tumor sizes and the SD, respectively. (B–G) The mice were subsequently tested for the levels of in vivo CTL lytic activity (B, control mice challenged with MC32 cells; C, control mice challenged with MC32-S2–2 cells; D, control mice challenged with MC32-S4–2 cells; E, pCEA-immunized mice challenged with MC32 cells; F, pCEA-immunized mice challenged with MC32-S2–2 cells; G, pCEA-immunized mice challenged with MC32-S4–2 cells) at 13 d post-challenge. For this experiment, CEA peptide-pulsed (CFSE high) and un-pulsed (CFSE low) splenocytes were injected i.v. into the immunized mice, as described in the Materials and Methods. After 20 h, the mice were sacrificed and the splenocytes were analyzed by FACS to measure the levels of CFSE-labeled cells in each subset. M1, un-pulsed CFSE low population; M2, CEA-pulsed CFSE high population. (H) %lytic activity of the tested groups. The values and bars represent mean CTL activity and the SD, respectively. *P < 0.05 using the independent sample's t test compared with MC32 or pcDNA3.

Figure 6. A lack of antitumor protective responses to MC32-S2–2 (A) and MC32-S4–2 cells in CEA DNA-immunized mice. Mice were immunized by IM-EP with CEA DNA vaccines at 0 and 1 weeks. At 3 weeks, the mice (B, D) were challenged s.c. with 1 × 10⁵ MC32 cells per mouse on the right flank and with 1 × 10⁵ MC32-S2–2 (B) and MC32-S4–2 cells (D) per mouse on the left flank. Age-matched control mice (A, C) were also challenged s.c. with 1 × 10⁵ MC32 cells per mouse on the right flank and with 1 × 10⁵ MC32-S2–2 (A) and MC32-S4–2 cells (C) per mouse on the left flank. Tumor sizes were measured at each time point and mean tumor volumes were recorded. The values and bars represent mean tumor volumes and the SD, respectively. *P < 0.05 using the independent sample's t test compared with MC32.
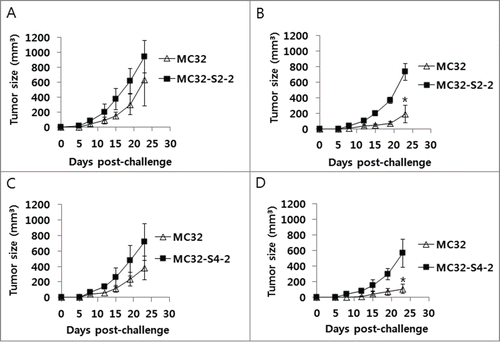
Figure 6. A lack of antitumor protective responses to MC32-S2–2 (A) and MC32-S4–2 cells in CEA DNA-immunized mice. Mice were immunized by IM-EP with CEA DNA vaccines at 0 and 1 weeks. At 3 weeks, the mice (B, D) were challenged s.c. with 1 × 10⁵ MC32 cells per mouse on the right flank and with 1 × 10⁵ MC32-S2–2 (B) and MC32-S4–2 cells (D) per mouse on the left flank. Age-matched control mice (A, C) were also challenged s.c. with 1 × 10⁵ MC32 cells per mouse on the right flank and with 1 × 10⁵ MC32-S2–2 (A) and MC32-S4–2 cells (C) per mouse on the left flank. Tumor sizes were measured at each time point and mean tumor volumes were recorded. The values and bars represent mean tumor volumes and the SD, respectively. *P < 0.05 using the independent sample's t test compared with MC32.

Reprints and Corporate Permissions

Please note: Selecting permissions does not provide access to the full text of the article, please see our help page How do I view content?

To request a reprint or corporate permissions for this article, please click on the relevant link below:

Academic Permissions

Please note: Selecting permissions does not provide access to the full text of the article, please see our help page How do I view content?

Obtain permissions instantly via Rightslink by clicking on the button below:

If you are unable to obtain permissions via Rightslink, please complete and submit this Permissions form. For more information, please visit our Permissions help page.