Figures & data
Figure 1. Example LC-MS/MS chromatogram for 4 monitored MRM transitions. Two peptides for NadA, one peptide for fHbp, and one peptide for the myoglobin internal standard are shown.
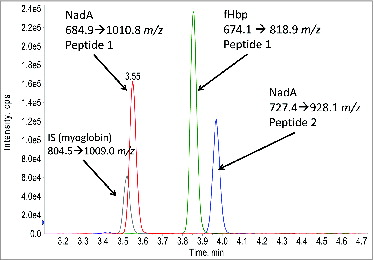
Table 1. List of MS/MS transitions used for routine MRM analysis
Figure 2. Comparison of percent abundance of fHbp determined using myoglobin or heavy labeled (N15) recombinant fHbp as the internal standard. Percent abundance was determined by dividing the measured concentrations of fHbp by the total protein concentration as assessed by BCA assay. Each internal standard experiment was run independently (on separate days). Results generated with the myoglobin internal standard are consistent with those from the recombinant heavy labeled protein and demonstrate the feasibility of this approach.
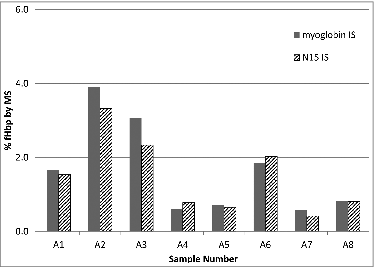
Figure 3. Impact of low digestion efficiencies on a peptide internal standard (IS). Recovery results are shown for either a peptide internal standard or myoglobin IS. Percent recovery was calculated using the area of the IS from the sample divided by the average of the internal standard area of all points of the standard curve. For controls, 2 calibration points (Std Curve) and one QC sample are shown along with 4 samples, 2 of which showed low digestion efficiency (samples B2 and B3) as demonstrated by the decreased recovery of the myoglobin peptide. As expected, this was not reflected in the recovery of the heavy labeled peptide IS. Because of this, the use of heavy labeled peptide IS would result in the reporting of an inaccurate antigen concentration in the cases where the sample matrix interferes with the digestion efficiency.
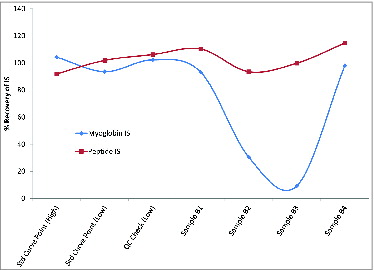
Figure 4. Comparison of Western Blot (A) and MS data (B) for OPC. Similar trends in OPC levels are observed between the Western Blot and the MS data when datasets are qualitatively evaluated. MS results (B) are reported as percentage of the total protein for a series of OMV samples. Percentage of total protein was determined by dividing the measured concentration of OPC by the total protein concentration. Sample numbers on gel (A) correspond to sample numbers in the graph (B).
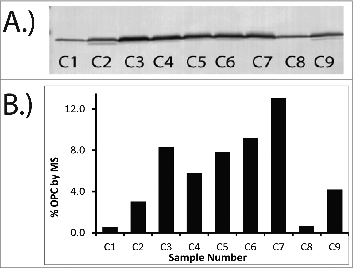
Table 2. Comparison of MS and SDS-PAGE results for PorA content for a series of OMV samples. For SDS-PAGE analysis, PorA content is expressed as a percentage of the total density. In order to compare the results from the MRM-based assay to the gels, the PorA concentration derived by MS was converted to percentage of total protein concentration. Levels of each PorA variant as well as the total PorA levels (sum of each variant) by MS are shown
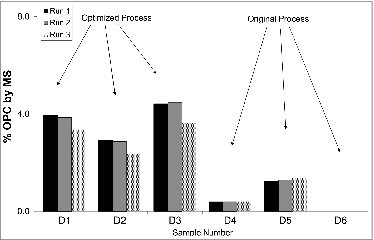
Figure 5. MS results for OPC content for a series of process samples. Three samples before and after process optimization are shown. Three replicates performed on successive days with independent standard curves of each sample are shown. Results are expressed as percent of OPC.