786
Views
7
CrossRef citations to date
0
Altmetric
Research Paper

Novel analysis of maturation of murine bone-marrow-derived dendritic cells induced by Ginkgo Seed Polysaccharides

, , , , , & show all
Pages 1387-1393 | Received 04 Nov 2014, Accepted 23 Feb 2015, Published online: 18 Jun 2015

Figures & data

Figure 1. Dose response of BMDCs to GSPs. The number of expanded BMDCs was determined from triplicate samples across time points in both media with 75 μg/mL GSP (Panel A) and GSP concentrations (Panel B) with use of MTS method. P-values. ** <0.01 for (A) GSP vs RPMI 1640 and (B) GSP concentration vs. RPMI 1640.
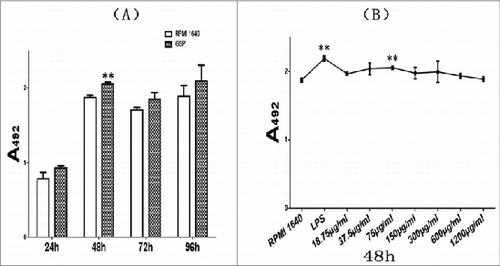
Figure 1. Dose response of BMDCs to GSPs. The number of expanded BMDCs was determined from triplicate samples across time points in both media with 75 μg/mL GSP (Panel A) and GSP concentrations (Panel B) with use of MTS method. P-values. ** <0.01 for (A) GSP vs RPMI 1640 and (B) GSP concentration vs. RPMI 1640.

Figure 2. Intracellular changes of BMDCs treated with GSPs under TEM. BMDCs were incubated for 48 hr and harvested by trypsinization, fixed in 2.5% gluteraldehyde/4% paraformaldehyde in 0.1 mol/L cacodylate buffer, and post-fixed in 1% osmium tetroxide buffer. After acetone dehydration, cells were embedded in spur resin. Thin sections were cut on a Reichert Ultracut E microtome, and stained with saturated uranylacetate and lead citrate solution. Sections were examined with TEM. Representative micrographs are shown for cells incubated in each of the 3 media.
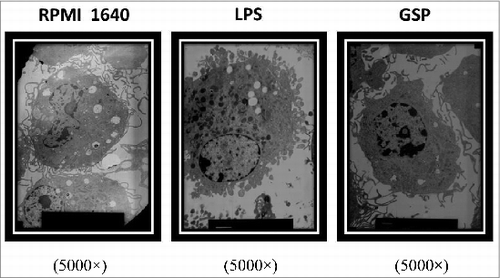
Figure 2. Intracellular changes of BMDCs treated with GSPs under TEM. BMDCs were incubated for 48 hr and harvested by trypsinization, fixed in 2.5% gluteraldehyde/4% paraformaldehyde in 0.1 mol/L cacodylate buffer, and post-fixed in 1% osmium tetroxide buffer. After acetone dehydration, cells were embedded in spur resin. Thin sections were cut on a Reichert Ultracut E microtome, and stained with saturated uranylacetate and lead citrate solution. Sections were examined with TEM. Representative micrographs are shown for cells incubated in each of the 3 media.

Figure 3. Elevation of key surface molecules on BMDCs. (A) Histograms of percent positive cells in the 3 different groups following incubation for 48 hr for each of the 5 indicated surface markers as analyzed by FACS. (B) Graphs representing frequency of percent positive cells for CD40, CD80, CD86, CD83 and MHC-II markers. Each value represents mean ± SEM. p-values: LPS × RPMI 1640 (CD80: <0.001; CD86: <0.05; CD83: <0.00001; CD40: <0.00001; MHC- II: <0.00001); GSP × RPMI 1640(CD80: <0.001; CD86: <0.05; CD83: <0.00001; CD40: <0.001; MHC- II: <0.05).
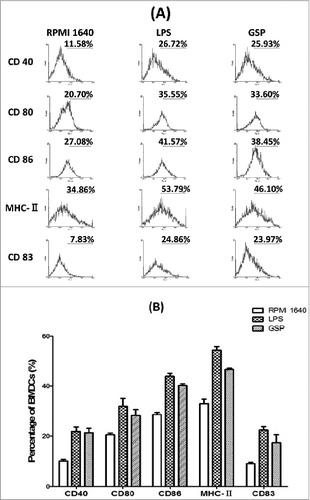
Figure 3. Elevation of key surface molecules on BMDCs. (A) Histograms of percent positive cells in the 3 different groups following incubation for 48 hr for each of the 5 indicated surface markers as analyzed by FACS. (B) Graphs representing frequency of percent positive cells for CD40, CD80, CD86, CD83 and MHC-II markers. Each value represents mean ± SEM. p-values: LPS × RPMI 1640 (CD80: <0.001; CD86: <0.05; CD83: <0.00001; CD40: <0.00001; MHC- II: <0.00001); GSP × RPMI 1640(CD80: <0.001; CD86: <0.05; CD83: <0.00001; CD40: <0.001; MHC- II: <0.05).

Figure 4. Phagocytosis of BMDCs confirmed by FCM. The % phagocytosis for BMDCs cultured in each of 3 media for 48 hr as shown in (A) distribution plots; and (B) Mean ± SE from three samples per group (RPMI 1640 vs. LPS: <0.00001; RPMI 1640 vs. GSPs: <0.00001).
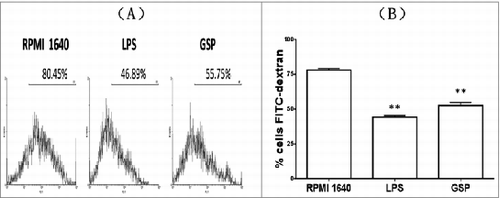
Figure 4. Phagocytosis of BMDCs confirmed by FCM. The % phagocytosis for BMDCs cultured in each of 3 media for 48 hr as shown in (A) distribution plots; and (B) Mean ± SE from three samples per group (RPMI 1640 vs. LPS: <0.00001; RPMI 1640 vs. GSPs: <0.00001).

Figure 5. Measurement of ACP activity. BMDCs are cultured in each of the 3 media for 48 h, and ACP activity was measured (RPMI 1640 vs. LPS: <0.01; RPMI 1640 vs. GSPs: <0.05).
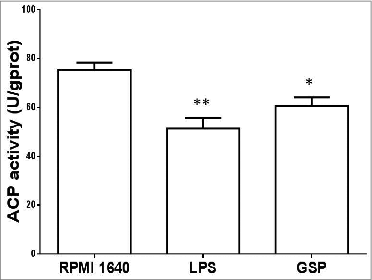
Figure 5. Measurement of ACP activity. BMDCs are cultured in each of the 3 media for 48 h, and ACP activity was measured (RPMI 1640 vs. LPS: <0.01; RPMI 1640 vs. GSPs: <0.05).

Figure 6. CD4+ T-cell proliferation driven by BMDCs treated by GSPs. The purified CD4+T cells were labeled with CFSE to quantify the number of cell divisions relative to T-cell proliferation. The purified CD4+T cells were resuspended in pre-warmed PBS containing 5 M CFSE and incubated at 37°C for 8 min. After washing twice with RPMI 1640+FCS10%, the cells were counted and further plated in plates. At the same time the BMDCs from different groups were seeded at different ratios in the plates. After 48 hr of co-culture, T cells were harvested, washed and stained with anti-CD4 MAb. Finally the net increased percentages of CD4+ T cells driven by BMDCs were determined using the CFSE technique by flow cytometry. Panel A shows statistical results of proliferation of CD4+T cells driven by BMDCs post treatment with GSPs. Panel B is an original profile of flow cytometry to prove proliferation of CD4+T cells.
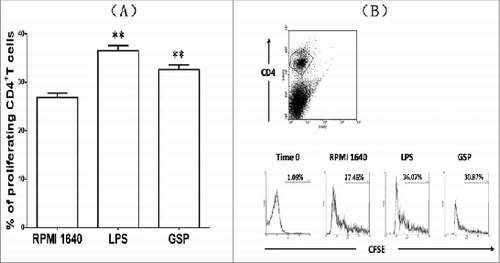
Figure 6. CD4+ T-cell proliferation driven by BMDCs treated by GSPs. The purified CD4+T cells were labeled with CFSE to quantify the number of cell divisions relative to T-cell proliferation. The purified CD4+T cells were resuspended in pre-warmed PBS containing 5 M CFSE and incubated at 37°C for 8 min. After washing twice with RPMI 1640+FCS10%, the cells were counted and further plated in plates. At the same time the BMDCs from different groups were seeded at different ratios in the plates. After 48 hr of co-culture, T cells were harvested, washed and stained with anti-CD4 MAb. Finally the net increased percentages of CD4+ T cells driven by BMDCs were determined using the CFSE technique by flow cytometry. Panel A shows statistical results of proliferation of CD4+T cells driven by BMDCs post treatment with GSPs. Panel B is an original profile of flow cytometry to prove proliferation of CD4+T cells.

Table 1. Levels of cytokines (ng/mL) secreted by BDMCs following incubation with various media

Reprints and Corporate Permissions

Please note: Selecting permissions does not provide access to the full text of the article, please see our help page How do I view content?

To request a reprint or corporate permissions for this article, please click on the relevant link below:

Academic Permissions

Please note: Selecting permissions does not provide access to the full text of the article, please see our help page How do I view content?

Obtain permissions instantly via Rightslink by clicking on the button below:

If you are unable to obtain permissions via Rightslink, please complete and submit this Permissions form. For more information, please visit our Permissions help page.