Figures & data
Table 1. Description of HIV+ population: Demographic information and immune status
Figure 1. IFNγ responses to HIV, FIV and SIV p24 peptide pools. The IFNγ ELISpot responses to overlapping peptide pools of HIV p24 (Hp1-Hp18, n = 31 ; A), FIV p24 (Fp1-Fp17, n = 31 ; B), and SIV p24 (Sp1-Sp17, n = 15 ; C) are depicted as spot forming units (SFU) per 106 PBMC. The HIV+ subjects (panel-A insert for A and B; panel-C insert) consisted of long-term survivors (LTS) without antiretroviral therapy (ART) (LTS; black bar); recently diagnosed subjects (<1 year) with short-term infection without ART (ST; gray bar); and those receiving ART with various duration of infection (ART+, red bar). Each bar represents a positive response by an individual subject with a threshold of >50 SFU per 106 PBMC. Asterisk after the peptide pool(s) represent those with highest frequency of responders. The FIV p24 pool with the highest and the most frequent responses and its counterpart HIV-1 and SIV pools are highlighted in blue.
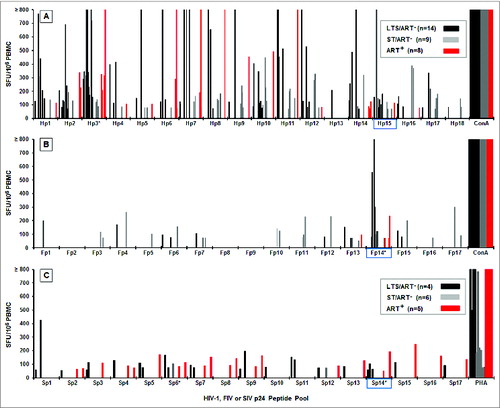
Figure 2. For figure legend, see page 6.
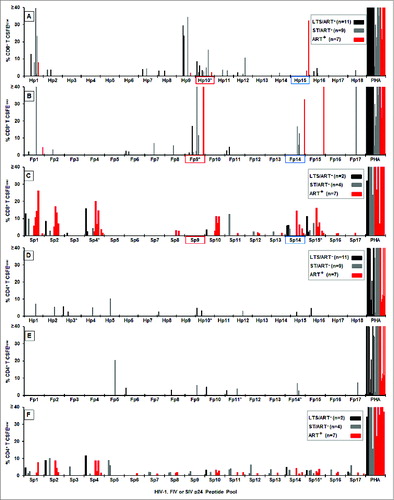
Figure 3. The persistence of IFNγ and T-cell proliferation responses to selected peptide pools. The IFNγ (A) and CD8+ T cell proliferation (B) responses of HIV+ subjects who responded at the first sample collection (t1), 2 y later (t2), and 4 y later (t3) are shown for peptide pool Fp14 (IFNγ), Hp15 (IFNγ), Hp10 (proliferation), and Fp9 (proliferation). The p-value indicates statistical differences between t1 and t2, t2 and t3, and t1 and t3. The threshold for IFNγ and proliferation responses are >50 SFU and >1% CFSElow, respectively.
Table 2. Fp9/Fp9–3, Fp14/Fp14–3, and their counterpart aa sequences and CMI responses
Figure 4. IFNγ and CD8+ T-cell proliferation responses to Fp9, Fp14, and Hp15 peptide epitopes. Peptide pool Fp14 consists of 4 overlapping 13–15mer peptides spanning the amino- to carboxyl-terminus (Fp14–1, Fp14–2, Fp14–3, Fp14–4), while pools Hp15 (Hp15–1, Hp15–2, Hp15–3) and Fp9 (Fp9–1, Fp9–2, Fp9–3) each consist of 3 overlapping 13–15mer peptides. IFNγ responses to individual Fp14 peptides (A; n=9 ), Hp15 peptides (B; n=9 ) and CD8+ T-cell proliferation responses to individual Fp9 peptides (C; n=7 ) are shown along with responses to their corresponding peptide pools. Only responders to pools Fp14 (A), Hp15 (B), and Fp9 (C) were tested. The responders consisted of long-term survivors (LTS) without ART (LTS; black bar); recently diagnosed subjects (<1 year) with short-term infection without ART (ST; gray bar); and those on ART with various duration of infection (ART+, red bar). Each bar with (*) in panels A and B are from the same 3 LTS.
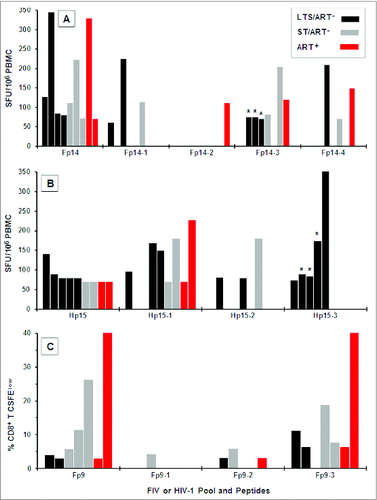
Table 3. Sequence conservation in EC p24 epitopes of Hp15/Fp14/Sp14 pools
Figure 5. IFNγ and T-cell proliferation responses to 9–13mers of FIV peptides Fp9–3, Fp14–3, and Fp14–4. Six 9–12mer peptides for the Fp9 pool (A1, B1, C1) and 7 9–13mer peptides for the Fp14 pool (A2, B2, C2) described in were tested for their ability to induce CD8+ T-cell proliferation (A), CD4+ T-cell proliferation (B), and IFNγ production (C) and compared to results with the Fp9 and Fp14 peptide pools. Thirteen–15mer peptides Fp9–3, Fp14–3, and Fp14–4; and mitogen (PHA) were included as controls. A total of 9 HIV+ responders to the Fp9 pool (A1, B1, C1) and 10 HIV+ responders to the Fp14 pool (A2, B2, C2) were tested up to 4 y after the beginning of the study. Two to 4 of the responders were lost to follow up. Their proliferation and IFNγ results to the 13–15mer peptides Fp9–3, Fp14–3, and Fp14–4, and are denoted with an (*) for each individual missing.
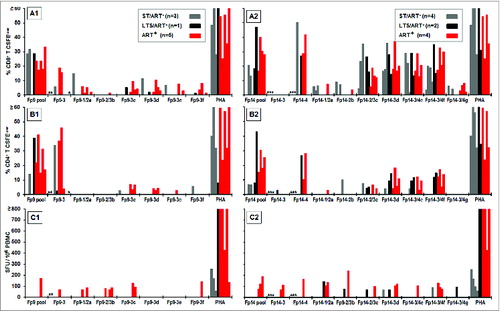
Table 4. 9–13mer T-cell epitope mapping of Fp9 and Fp14 sequences using responders to Fp9 or Fp14
Table 5. HLA supertypes of the responders to key short and long peptides
Figure 6. Stimulation of cytotoxins by CTL epitopes on Fp9, Fp14, and Hp15 peptide pools, and their individual peptides. The ICS analyses for perforin (Perf, ○), granzyme A (GrzA, □), and granzyme B (GrzB, Δ) are shown for CD8+ T cells (A, D) and CD4+ T cells (B, C) from 5 HIV+ responders with or without ART. Two LTS/ART−, one LTS/ART+, one ST/ART+, and one ST/ART− were first evaluated (A, B). Peptides tested included Fp9, Fp14, and/or Hp15 peptide pools or large 13–15mer peptides (A, B). Responses from 5 HIV+ responders of short-term HIV-infected subjects not on ART (ST/ART−) were tested using small 9–13mer peptides within Fp9–3, Fp14–1, Fp14–3, Fp14–4, and Sp14–1 (C, D). Note that Sp14 pool is a single 13mer peptide Sp14–1. Counterpart peptides are shown with blue-dashed box for Fp14–1a/Hp15–1c/Sp14–1c, purple-dashed box for Fp14–1b/Hp15–1a/Sp14–1b, and red-dashed box for Fp14–3/4f/Hp15–2/3a/Sp14–1a. The peptides tested with one less subject are denoted by (**), while their number of subjects and number of responses are denoted by (*). Each separate symbol color represents one subject, and each color-coded subject is shown with his/her infection status. The threshold for T cells expressing cytotoxin is set at >0.1% CD4+ or CD8+ T cells.
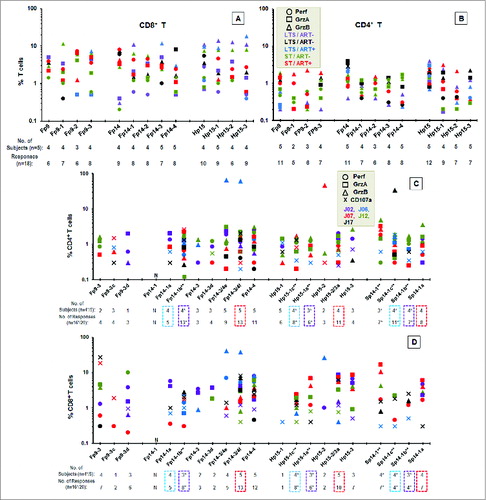
Figure 7. Direct effect of Fp9–3, Hp15–1, and Hp15–3 peptides on in vitro HIV-1 infection. The direct effect of FIV peptides Fp9–3 and FRT3–4 (light gray bar), HIV-1 peptides Hp15–1 and Hp15–3 (dark gray bar), and virus positive control (+ control, black bar) on HIV-1 infection of PBMC from healthy uninfected subjects is shown as average end-point dilution titer with standard deviation. Staphylococcal enterotoxin A control (SEA, white bar) is included as a T-cell mitogen control to serve as positive control for FIV enhancement. FIV reverse transcriptase peptide FRT3–4 previously reported to be non-reactive to T cells from HIV− subjects is included as a negative control.Citation48 Statistically significant difference between the average result of each peptide and the average virus control are shown with (*) for P < 0.02 and (**) for p < 0.001.
Figure 8. Summary of functional epitope analyses. Results from 3 functional analyses are summarized according to frequency of HIV+ (lanes 1–4) or HIV− (lane 5) responders and are shown as (+) for frequency of >25 % responders, (±) for 19–25% responders, (−) for <19% responders, or as (*) for not available. Each lane, abridged in the insert, shows the ability of the peptide pool or peptide to stimulate an IFNγ response (lane 1), CD8+ T-cell proliferation (lane 2), and CD4+ T-cell proliferation (lane 3). Lane 4 denotes the ability to induce cytotoxin(s) in only CD8+ T cells (+) or in both CD8+ and CD4+ T cells (++) by 4 or more HIV+ subjects when at least 9 subjects tested. In lane 5, the positive result (+) indicates substantial frequency of proliferation responses from HIV− subjects and may indicate a safety concern; whereas a negative result (−) indicates no substantial HIV− response to the peptide pool or peptide. Positive response of HIV− control had CD8+ T-cell proliferation response in 30–42% of HIV− subjects. The large 13–15mer peptides with the best CMI responses without stimulation in HIV− subjects are shown with dashed boxes, while the best small peptides are shown with solid boxes. Therefore, Hp15–1, Hp15–2/3a, Fp14–4, Fp14–1b, Fp14–3/4e, and Fp14–3/4f peptides appear to contain the best potential epitopes to target for use as HIV immunogens.