1,466
Views
6
CrossRef citations to date
0
Altmetric
Research Papers

A microarray MEMS device for biolistic delivery of vaccine and drug powders

, , , , , , , , , , & show all
Pages 1936-1944 | Received 26 Dec 2014, Accepted 06 Mar 2015, Published online: 11 Aug 2015

Figures & data

Figure 1. MEMS device with parallel microchannel arrays and device working principle. (A) MEMS device assembled in a prototype test cell with gas and payload inlets. (B) Scanning electron microscope (SEM) image of the fabricated device showing the parallel channels with Venturi structure and inlet of therapeutic particles. (C) Schematic illustration of operation for one channel. Pressurized gas is supplied to the inlet of the channel and accelerated after the Venturi constriction followed by particle entrainment using the mild suction generated by a brief gas pressure drop. (D) CFD simulation of pressure profile for different widths wt of the Venturi neck (wt = w, wt = w/2, and wt = w/4 where w is the channel width) along a 4 mm long channel with a cross section of 64 × 64 μm2. (E) CFD simulation of velocity profile along a 6.5 mm long channel with a cross-section of 600 × 600 μm2. Simulations in D and E used air as the pressurized gas and did not include particles.
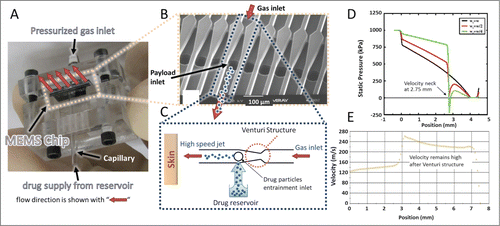
Figure 1. MEMS device with parallel microchannel arrays and device working principle. (A) MEMS device assembled in a prototype test cell with gas and payload inlets. (B) Scanning electron microscope (SEM) image of the fabricated device showing the parallel channels with Venturi structure and inlet of therapeutic particles. (C) Schematic illustration of operation for one channel. Pressurized gas is supplied to the inlet of the channel and accelerated after the Venturi constriction followed by particle entrainment using the mild suction generated by a brief gas pressure drop. (D) CFD simulation of pressure profile for different widths wt of the Venturi neck (wt = w, wt = w/2, and wt = w/4 where w is the channel width) along a 4 mm long channel with a cross section of 64 × 64 μm2. (E) CFD simulation of velocity profile along a 6.5 mm long channel with a cross-section of 600 × 600 μm2. Simulations in D and E used air as the pressurized gas and did not include particles.

Table 1. Summary of devices and particles used in in vitro penetration studies

Figure 2. Cross-sectional images of particles penetration profiles after ejection into gelatin at 70 psi inlet pressure. Device A (400 × 400 µm2 channel cross-section) was used for ejections in (A-D, G) and Device B (1000 × 400 µm2 channel cross-section) was used for ejection in (E) where both devices had a single nozzle enabled for ejections. The ejection dose was ∼13.6 µg for low-density particles shown in (A), 200 µg for high-density particles shown in B and C, ∼215 µg for mixture of particles shown in (D and E) and a total of 1mg for multiple ejections shown in G. (A) Penetration of low-density polystyrene-based particles with density of ∼1050 kg/m3. (B) Penetration of tungsten particles with density of ∼19250 kg/m3. (C) Penetration of gold particles with density of ∼19300 kg/m3 that were coated with pDNA at 10 µg DNA in 1 mg of gold. (D and E) Penetration of a mixture of low and high density particles. (F) Maximum penetration of particles in a-e (n = 3). The error bars represent one standard deviation from measured values. (G) Penetration of pDNA-coated gold particles after 5 sequential ejections for 1 mg dose delivery.
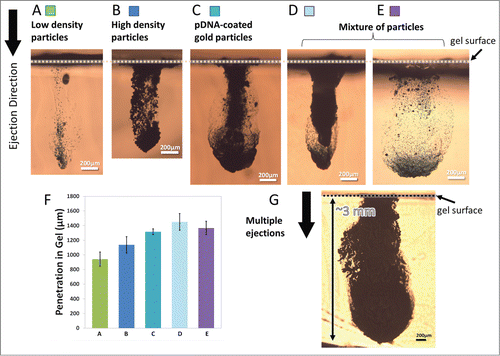
Figure 2. Cross-sectional images of particles penetration profiles after ejection into gelatin at 70 psi inlet pressure. Device A (400 × 400 µm2 channel cross-section) was used for ejections in (A-D, G) and Device B (1000 × 400 µm2 channel cross-section) was used for ejection in (E) where both devices had a single nozzle enabled for ejections. The ejection dose was ∼13.6 µg for low-density particles shown in (A), 200 µg for high-density particles shown in B and C, ∼215 µg for mixture of particles shown in (D and E) and a total of 1mg for multiple ejections shown in G. (A) Penetration of low-density polystyrene-based particles with density of ∼1050 kg/m3. (B) Penetration of tungsten particles with density of ∼19250 kg/m3. (C) Penetration of gold particles with density of ∼19300 kg/m3 that were coated with pDNA at 10 µg DNA in 1 mg of gold. (D and E) Penetration of a mixture of low and high density particles. (F) Maximum penetration of particles in a-e (n = 3). The error bars represent one standard deviation from measured values. (G) Penetration of pDNA-coated gold particles after 5 sequential ejections for 1 mg dose delivery.

Figure 3. Operating pressure effect on particle penetration after ejection into gelatin. (A) Representative cross-sectional images of tungsten particles penetration into gelatin samples using Device A at various operating pressures. (B) Maximum penetration of tungsten particles (200 µg dose) increases while the inlet pressure increases following single ejection (n = 3). (C) Device ejection efficiency defined as the extracted pDNA-coated gold particles from the gel after ejection of defined quantities of particles in 5 consecutive pulses at 70 psi (n = 6). The error bars represent one standard deviation from measured values.

Figure 3. Operating pressure effect on particle penetration after ejection into gelatin. (A) Representative cross-sectional images of tungsten particles penetration into gelatin samples using Device A at various operating pressures. (B) Maximum penetration of tungsten particles (200 µg dose) increases while the inlet pressure increases following single ejection (n = 3). (C) Device ejection efficiency defined as the extracted pDNA-coated gold particles from the gel after ejection of defined quantities of particles in 5 consecutive pulses at 70 psi (n = 6). The error bars represent one standard deviation from measured values.

Figure 4. The effect of particle preparation, processing before loading, and jetting on the integrity of pDNA coated on gold particles. The graph shows the ratio of the supercoiled conformation to all forms present in the original gWiz plasmid.
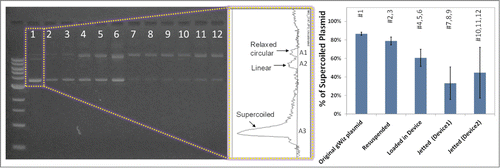
Figure 4. The effect of particle preparation, processing before loading, and jetting on the integrity of pDNA coated on gold particles. The graph shows the ratio of the supercoiled conformation to all forms present in the original gWiz plasmid.

Figure 5. Delivery of pDNA-coated gold particles into the ex vivo skin models. (A) Schematic diagram of a single nozzle of a device operating to deliver pDNA-coated gold particles into the freshly excised skin placed over a gel as a soft substrate. Schematic is not to scale. (B) Histology of mouse skin tissue by hematoxylin and eosin (H&E) staining after ejected with gold particles, visualized by bright field microscopy. (C) Dark field microscopy of histology sample in B reveals the glowing gold particles penetrated into the skin. (D) Histology of pig skin tissue by H&E staining after bombardment visualized by dark field microscopy.
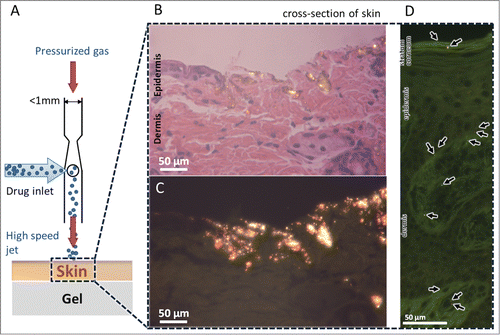
Figure 5. Delivery of pDNA-coated gold particles into the ex vivo skin models. (A) Schematic diagram of a single nozzle of a device operating to deliver pDNA-coated gold particles into the freshly excised skin placed over a gel as a soft substrate. Schematic is not to scale. (B) Histology of mouse skin tissue by hematoxylin and eosin (H&E) staining after ejected with gold particles, visualized by bright field microscopy. (C) Dark field microscopy of histology sample in B reveals the glowing gold particles penetrated into the skin. (D) Histology of pig skin tissue by H&E staining after bombardment visualized by dark field microscopy.