
Figures & data
Table 1. Demographics of patients included in the study
Figure 1. Serum hemagglutination inhibition (HI) antibody against the H1N1 and H3N2 vaccine viruses.
Figure 2. Identifying gene clusters that are involved in B and T cell activation. The colour gradient green-black-red represents relative level of gene expression, indicating under-even-over expression, respectively. The cluster gram shows a 2-way non-supervised hierarchical clustering of the entire data set, while displaying a heat map with a horizontal and vertical dendrogram indicating co-regulated genes across groups.
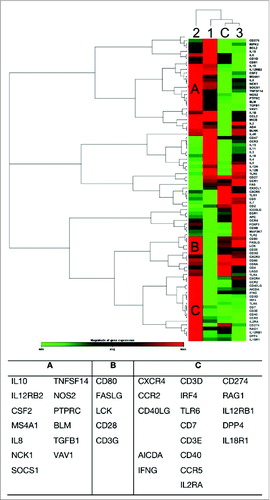
Figure 3. T cell specific gene expression. T cell specific genes were classified into 6 different categories (A) regulators of T cell activation, (B) T cell proliferation, (C) T cell differentiation, (D) T cell polarization, (E) regulators of Th1 and Th2 development, and (F) Th1 and Th2 differentiation, as indicated above each plot. Each symbol represents the mean expression level (+/− range) of T cell specific genes compared to controls. The groups 1 to 3 are described in the text. The vertical scale indicates whether these genes are up- or downregulated, where positive values on the y-axis represent an up-regulation of genes, and negative values represent a down-regulation.
Figure 4. B cell specific gene expression. Genes involved in B cell activation were classified into 4 main groups, specifically (A) antigen-dependent B cell activation, (B) B cell proliferation, (C) B cell differentiation and (D) other genes involved in B cell activation. Fold change values for all the genes combined at each time point were plotted and compared to the controls. Each symbol represents the mean level (+/− range) of B cell specific gene expression. The vertical scale indicates fold change of gene expression.
Figure 5. The expression of other immune cell related genes. Genes involved in the activation of other immune cells include (A) macrophage activation, (B) neutrophil activation, (C) natural killer cell activation, and (D) leukocyte activation. Each plot represents the relative expression of the respective combined cell specific gene in the test groups compared to controls. The symbols indicate the mean gene expression level for the 3 groups (x-axis), and the range is indicated with vertical lines. The y-axis represents the fold change in gene expression levels.
Figure 6. For figure legend, see page 1669Figure 6 (See previous page). Volcano plots of individual genes (dots) that are under and overexpressed compared to baseline (Controls). The horizontal axis indicates the relative level of expression with a vertical line dividing the under expressed genes to the left (green) and over expresses to the right (red). The y-axis indicates the statistical level of the change in gene expression with a horizontal line indicating the threshold (P-value < 0.05), and genes situated above the line are denoted significant using the student t-test. (A) gene expression in Group 1 (3–4 days post vaccination) compared to controls. The green (left, n = 45) and red (right, n = 39) dots represent the under and overexpressed genes respectively. (B) gene expression in Group 2 (6–7 days post-vaccination). The red (left, n = 62) and green (right, n = 22) dots represent genes that are over and under expressed respectively. (C) The genes that are over expressed (red, n = 52) and under expressed (green, n = 32) 12–15 days following vaccination compared to controls.
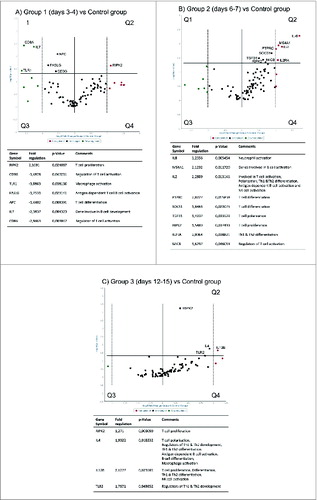
Figure 7. A suggested working model for LAIV. Upon vaccination with LAIV by intranasal droplets (1), limited virus replication of the vaccine strains may occur in the nasal epithelial lining (2). Since we were not able to detect viral RNA in the tonsillar tissue, this indicates that viral antigens are transported to the tonsils by activated DCs (3) and not through local vaccine virus replication. We observed in this study that B and T cells are activated by changes in gene expression profiles, which are most pronounced at days 6–7 post vaccination (4, 5). An efflux of activated lymphocytes that may migrate to the site of infection/vaccination (6) as is supported by an earlier study.Citation45 Systemic and mucosal responses (7) were detected in these subjects after LAIV vaccination [21 and unpublished data].
![Figure 7. A suggested working model for LAIV. Upon vaccination with LAIV by intranasal droplets (1), limited virus replication of the vaccine strains may occur in the nasal epithelial lining (2). Since we were not able to detect viral RNA in the tonsillar tissue, this indicates that viral antigens are transported to the tonsils by activated DCs (3) and not through local vaccine virus replication. We observed in this study that B and T cells are activated by changes in gene expression profiles, which are most pronounced at days 6–7 post vaccination (4, 5). An efflux of activated lymphocytes that may migrate to the site of infection/vaccination (6) as is supported by an earlier study.Citation45 Systemic and mucosal responses (7) were detected in these subjects after LAIV vaccination [21 and unpublished data].](/cms/asset/653f49e8-41b5-4f9e-a232-3380823ac9ad/khvi_a_1032486_f0007_oc.jpg)