Figures & data
Table 1. Details of examined lots of bioCSL's IVV for the 2013 SH season
Table 2. Results of description test and additional comments for 5 lots of bioCSL's 2013 SH IVV (18 syringes per lot, 90 syringes in total)
Figure 1. Representative ILM images for 5 lots of bioCSL's 2013 SH IVV, including lots 090634903, 090635001, 090636401, 090637301 and 090638202, when syringes were left unshaken (left column) and following vigorous shaking (right column).
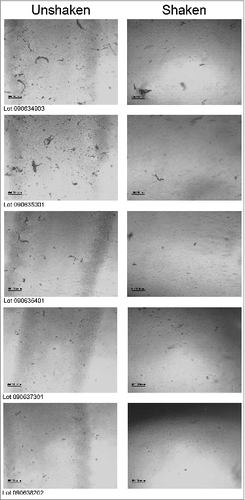
Table 3. Summary of ILM results for the appearance of bioCSL's 2013 SH IVV
Figure 2. Representative EM images for pooled material corresponding to each of the 5 lots of bioCSL's 2013 SH IVV at a magnification of 108,500x for lots (A) 090634903, (B) 090635001, (C) 090636401, (D) 090637301 and (E) 090638202; and at a magnification of 32,200x for lot (F) 090638202.
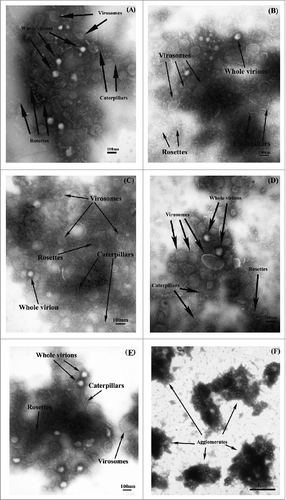
Figure 3. Average protein recovery in supernatant (expressed as %ODT) for 5 pooled groups within each of 5 lots of bioCSL's 2013 SH IVV, including lots (A) 090634903, (B) 090635001, (C) 090636401, (D) 090637301 and (E) 090638202, by ODT analysis post-centrifugation at an RCF of 13,684 g for 1 min.
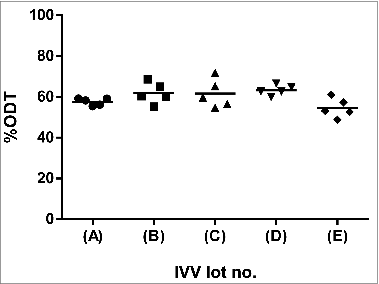
Table 4. Density, viscosity and refractive index (RI) properties of pooled 2013 SH IVV for DLS analysis at 25°C
Figure 4. Average intensity PSDs (n = 5) of the supernatant for 5 pooled groups within each of 5 lots of bioCSL's 2013 SH IVV, including lots (A) 090634903, (B) 090635001, (C) 090636401, (D) 090637301 and (E) 090638202, by DLS analysis at 25°C post-centrifugation at an RCF of 6,082 g for 1 min.
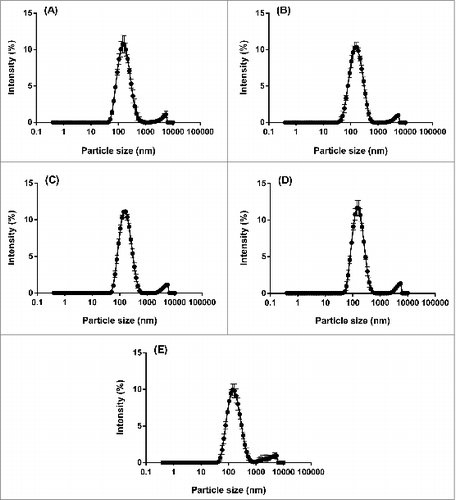
Figure 5. Average volume PSDs (n = 5) of the supernatant for 5 pooled groups within each of 5 lots of bioCSL's 2013 SH IVV, including lots (A) 090634903, (B) 090635001, (C) 090636401, (D) 090637301 and (E) 090638202, by DLS analysis at 25°C post-centrifugation at an RCF of 6,082 g for 1 min.
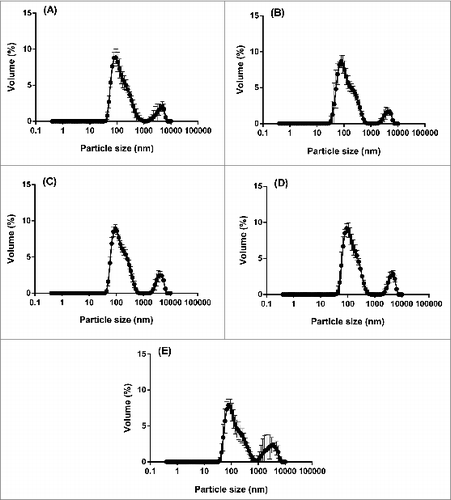
Figure 6. Average UV-visible absorbance (AU) vs. wavelength (nm) profiles for 5 lots of bioCSL's 2013 SH IVV, including lots (A) 090634903, (B) 090635001, (C) 090636401, (D) 090637301 and (E) 090638202, performed neat for each lot (n = 3).
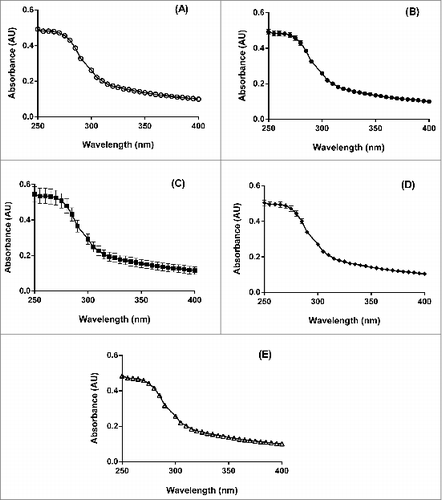
Table 5. Agglomeration index (AI;%) for 5 lots of 2013 SH IVV, determined from UV-visible absorbance spectroscopy analysis
Table 6. Example ODT analysis for IVV
