
Figures & data
Figure 1. SDS-PAGE and Western blotting analysis of targeted proteins. (A) SDS-PAGE analysis of mtRTA. (B) Western blotting analysis of mtRTA. Lanes M: low molecular weight protein markers. Lane 1 and 1′: purified mtRTA. Lane 2 and 2′: purified rRTA (control).
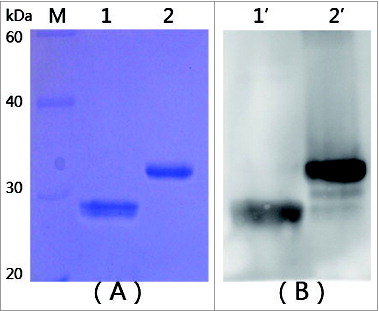
Figure 2. Cytotoxic effects of proteins in the BEAS-2B cells. The toxicities of target proteins, mtRTA (•
 ) and RT (▾
 ), were tested using the CellTiter 96® AQueous One Solution Cell Proliferation Assay, by measuring the toxicities in the human bronchial epithelial cell-line BEAS-2B. The X-axis represents the concentration of different proteins (mtRTA, rRTA and RT), and the Y-axis represents the cell viability. Each point represents the arithmetic mean ± SD of triplicate determinations. “*” represents P < 0.05.
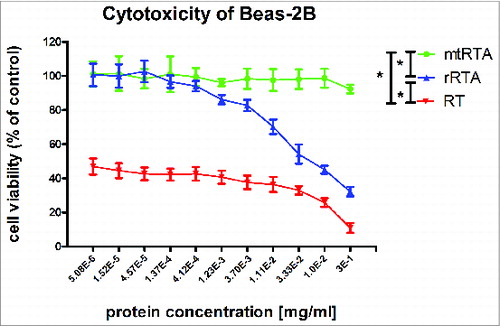
Figure 3. Histopathologic alterations in the lungs of mice. The mice i.p injected with 0.5 mg of rRTA (A), 0.1 mg of rRTA (B), 0.5 mg of mtRTA (C) and 0.1 mg of mtRTA (D). Both (A) and (B) showed the pathological changes, including: epithelial necrosis, partial consolidation and generalized interstitial edema. In addition, the pathological changes in (A) were more severe than that in (B). No obvious pathological changes was found in (C) and (D) as compared to the normal mouse lung histology shown in (E).
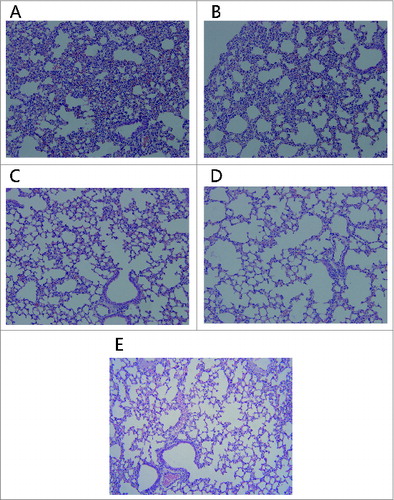
Table 1. The sequence of primers
Table 2. Toxicity assay in the mouse
Figure 4. Measurement of antibody titers. All immunization schedules involved mice that were s.c. immunized 3 times at 2 weeks interval and sera specimens were collected from the tail veins of mice, which were then used to measure antibody titers by ELISA one week after the second and third immunization respectively. The graphs show arithmetic mean antibody titers of 10 mice per group ± SD. The X-axis “vaccination 2, 3” represents the time point one week following the second and third immunization respectively. The Y-axis represents the antibody titers. Titer was calculated as the reciprocal of the highest dilution having an OD450 greater than 0.1 AU (absorbance unit) after correcting for background.
Table 3 Recombinant mtRTA immunogen protect mice from different doses of RT i.p. injection
Table 4. Recombinant mtRTA immunogen protect mice from different doses of RT intratracheal spraying
Figure 5. Toxin neutralization assay in BEAS-2B cell line model. 50 μl RT of different concentrations (triple serial diluted) were incubated with the same volume (50 μl) of the immune sera (•
 ) or no serum (▴
 ) at 37°C for 1 h, and then added to the cells. The X-axis represents the concentration of RT, the Y-axis represents the cell viability. “*” represents P < 0.05.
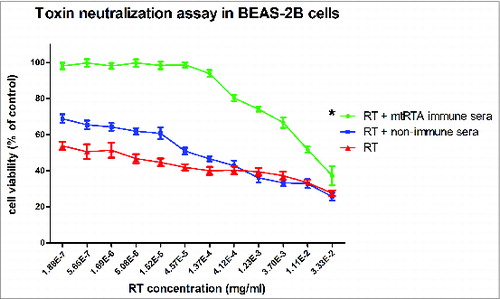
Table 5. Assay of passive protection against RT challenge in mice