939
Views
11
CrossRef citations to date
0
Altmetric
Short Report

Passive protection of mice against Streptococcus pneumoniae challenge by naturally occurring and vaccine-induced human anti-PhtD antibodies

, , , , , , & show all
Pages 1836-1839 | Received 30 Jan 2015, Accepted 04 Apr 2015, Published online: 06 Jul 2015

Figures & data

Figure 1. Dose-response of antibody activity in the passive protection model. 6- to 8-week-old female naïve CBA/N mice (n = 5/group) received an intraperitoneal injection of 200 µl test sample or PBS. Control mice received PBS. After 1 h, mice were challenged intravenously with a lethal dose of S. pneumoniae strain A66.1 (serotype 3), and survival was monitored for 14 days. Data were analyzed using logistic regression with probit link under PROC GLIMMIX in SAS version 8.2 to determine the ED50. In each plot, circles indicate survival data for individual samples, and the best fit regression is shown as a green line, with the upper and lower limits of the 95% confidence interval shown as yellow and red lines, respectively. The horizontal line indicates a median response of 50% survival. In (A), mice were injected with 2.8–27.5 EU (1–10 µg) of purified anti-PhtD antibody or PBS. Survival data were from 4 passive protection experiments, which included 13 survival points. In five of the 13 cases (206, 275, 687, 1375, 2063, and 2750 EU/ml), the passive protection experiment was performed twice, and for 2 of these (275 and 2750 EU/ml), the points overlap and appear as a single data point. Protection experiments for 3 cases (43, 435, and 2178 EU/ml) were not repeated and were included to provide a more appropriate range of antibody concentrations. In (B), mice were injected with 1:20 to 1:60 post-immune sera. To account for the baseline levels of protection seen in the pre-immune sera, the analysis was corrected for over-dispersion using PROC GENMOD with the SCALE = option in SAS version 9.13 and based on survival data from mice that received pre- and post-immune sera.

Figure 1. Dose-response of antibody activity in the passive protection model. 6- to 8-week-old female naïve CBA/N mice (n = 5/group) received an intraperitoneal injection of 200 µl test sample or PBS. Control mice received PBS. After 1 h, mice were challenged intravenously with a lethal dose of S. pneumoniae strain A66.1 (serotype 3), and survival was monitored for 14 days. Data were analyzed using logistic regression with probit link under PROC GLIMMIX in SAS version 8.2 to determine the ED50. In each plot, circles indicate survival data for individual samples, and the best fit regression is shown as a green line, with the upper and lower limits of the 95% confidence interval shown as yellow and red lines, respectively. The horizontal line indicates a median response of 50% survival. In (A), mice were injected with 2.8–27.5 EU (1–10 µg) of purified anti-PhtD antibody or PBS. Survival data were from 4 passive protection experiments, which included 13 survival points. In five of the 13 cases (206, 275, 687, 1375, 2063, and 2750 EU/ml), the passive protection experiment was performed twice, and for 2 of these (275 and 2750 EU/ml), the points overlap and appear as a single data point. Protection experiments for 3 cases (43, 435, and 2178 EU/ml) were not repeated and were included to provide a more appropriate range of antibody concentrations. In (B), mice were injected with 1:20 to 1:60 post-immune sera. To account for the baseline levels of protection seen in the pre-immune sera, the analysis was corrected for over-dispersion using PROC GENMOD with the SCALE = option in SAS version 9.13 and based on survival data from mice that received pre- and post-immune sera.

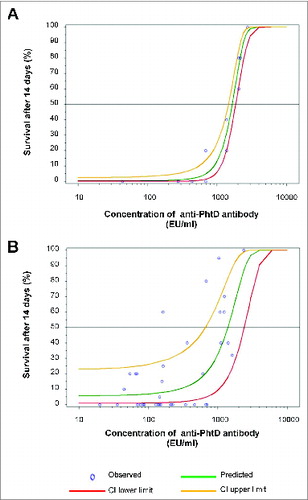
Table 1. Anti-PhtD titers and survival mediated by the 18 selected paired pre-/post-immune sera

Table 2. Specificity of vaccine-induced antibody