
Figures & data
Figure 1. Observed (A) and predicted (B) seroprotection rates with 95% CI (Total vaccinated cohort). Predicted seroprotection rate (%) = Predicted percentage of subjects with anti-HBs concentration ≥10 mIU/ml evaluated from the best fit logistic regression model where Ln (P/1-P) = 4.23−0.07*age and P represents seroprotection rate. Vertical lines indicate 95% confidence intervals.
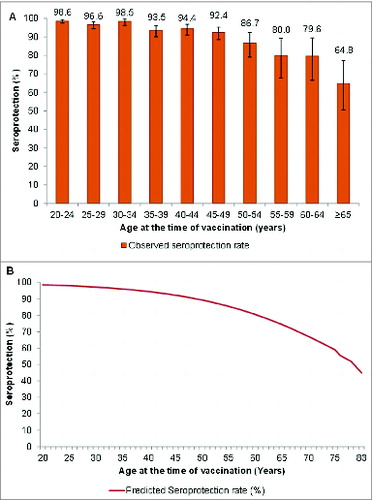
Table 1. Summary of subject characteristics by age group (total vaccinated cohort)