Figures & data
Figure 1. Construction and Characterization of Recombinant Ad5 Vectors Carrying Four Forms of Ag85A-Mtb32 Fusion Genes. (A). Schematic presentation of Ad5 vectors carrying 4 forms of Ag85A-Mtb32 fusion genes. An HA tag and a Flag tag were added to the Napos; terminus of Ag85A and the COOHapos; terminus of Mtb32 for expression detection. (B). The function mechanism of 2A auto-cleavage peptide in the expression of Ag85A-Mtb32 fusion antigens. (C). The expression of Ag85A and Mtb32 by recombinant Ad5 vectors. Vero cells were infected with Ad5-optAM (Lane 1, 2), Ad5-wtAM (Lane 3, 4), Ad5-gsgAM (Lane 5,6), Ad5-ΔsAM (Lane 7, 8) and a control vector Ad5-Empty (Lane 9,10), and the cell lysates (Lane 1, 3, 5, 7, 9) and the culture medium (Lane 2, 4, 6, 8, 10) were subjected to SDS-PAGE followed by western blot analysis using anti-HA tag (upper), anti-Flag tag (middle), and anti-β actin antibodies (bottom).
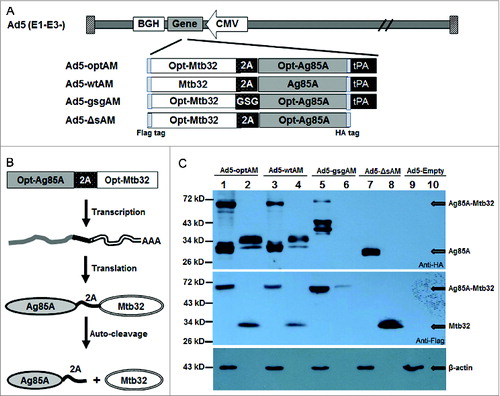
Figure 2. Subcellular Localization of Ag85A and Mtb32. Vero cells were seeded and infected with respective rAd5 vectors carrying different forms of Ag85A-Mtb32 fusion genes, an Ad5-Empty was used as a control. After 48 hours, the cells were labeled with FITC-labeled anti-Flag antibody and PE-labeled anti-HA antibody and subsequently stained with DAPI. Images were viewed and photographed using a fluorescence microscope.
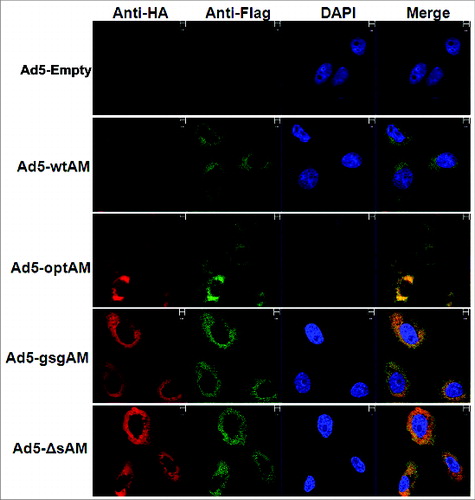
Figure 3. Ag85A and Mtb32 Specific IFN-γ+ Spot-forming Cells Generated by Various Ag85A-Mtb32 Fusion Antigens. (A). The schedule of immunization and detection. (B). The frequency of IFN-γ+ spot-forming splenocytes at 2 weeks after IM prime. (C). The frequency of IFN-γ+ spot-forming lung lymphocytes at 2 weeks post IM prime. (D). The frequency of IFN-γ+ spot-forming splenocytes at 2 weeks post IN boost. (E). The frequency of IFN-γ+ spot-forming lung lymphocytes at 2 weeks post IN boost. C57BL/6 mice were immunized with control Ad5-empty or rAd5 vectors carrying Ag85A-Mtb32 fusion genes using an IM prime plus IN boost strategy. At 2 weeks after prime or boost, splenocytes and lung lymphocytes were harvested and cultured with peptide pools for each antigen and subjected to an IFN-γ ELISPOT assay. The data were analyzed by 2-way ANOVA. The bars represent the standard error of the mean. *p < 0.05; **p < 0.01; ***p < 0.001.
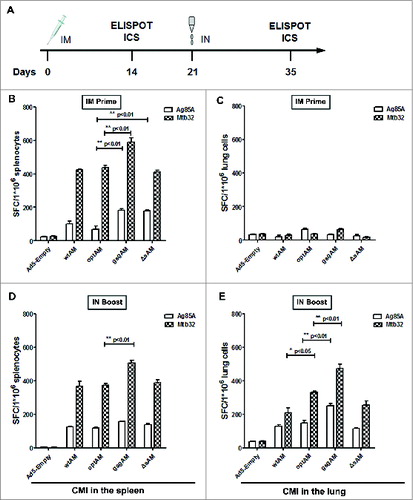
Table 1. Immunization and detection schedule for the evaluation of Ad5 vectors carrying various Ag85A-Mtb32 fusion antigens
Table 2. Schedule for Ad5-gsgAM boost following BCG primary immunization
Figure 4. Cytokine secretion profiling of Antigen-specific CD4+ and CD8+ T Cells. C57BL/6 mice were immunized with Ad5 vectors carrying Ag85A-Mtb32 fusion genes using an IM prime followed by IN boost immunization strategy as shown in . At 2 weeks after boost immunization, splenocytes (A and C) and lung lymphocytes (B and D) were harvested and cultured with peptide pools for each antigen. A flow cytometry assay based on intracellular cytokine staining was used to quantify antigen-specific cytokine-secreting CD4+ and CD8+ T cells. The percentage of Ag85A specific CD4+ T cell and Mtb32 specific CD8+T cell which secreted mono-(dark blue), dual-(green), and triple-(red) cytokines are shown in the pie charts. The data represents one of the 2 independent experiments.
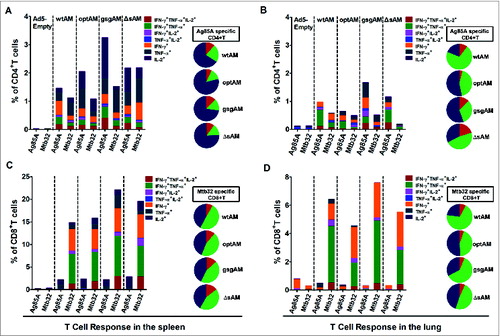
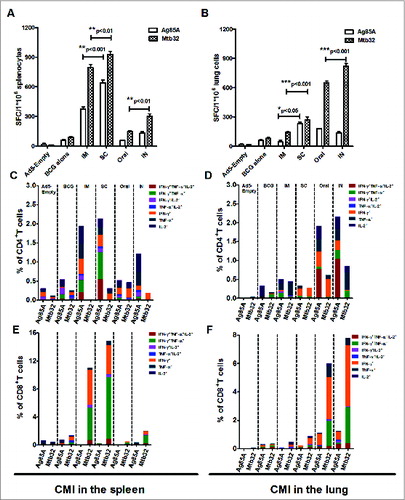
Figure 5. Boosting Effects of Ad5-gsgAM on BCG-primed Cell-mediated Immune Responses through Various Immunization Routes. (A). The frequency of IFN-γ spot-forming splenocytes specific for Ag85A and Mtb32 at 2 weeks post-boost. (B). The frequency of IFN-γ spot-forming lung lymphocytes specific for Ag85A and Mtb32 at 2-weeks post boost. (C). The percentage of antigen-specific cytokine-secreting CD4+ T cells of total CD4+ T cells in the spleen. (D). The percentage of antigen-specific cytokine-secreting CD4+ T cells of total CD4+ T cells in the lung. (E). The percentage of antigen-specific cytokine-secreting CD8+ T cells of total CD8+ T cells in the spleen. (F). The percentage of antigen-specific cytokine-secreting CD8+ T cells of total CD8+ T cells in the lung. C57BL/6 mice were first primed with BCG and then immunized with Ad5-gsgAM through 4 routes: IM, SC, IN, and oral. Splenocytes and lung lymphocytes were isolated and subjected to IFN-γ ELISPOT assay and intracellular cytokine staining followed by flow cytometry analysis. The data represents one of 2 independent experiments.