Figures & data
Table 1. Monoclonal antibodies used for flow cytometry/immunohistochemistry
Figure 1. CD229 is strongly and homogeneously overexpressed on BM plasma cells. Expression of CD229 was assessed by flow cytometry on whole BM samples, which were collected as parts of routine diagnostic procedures. The study protocol had received approval by the local internal review boards at both institutions. BM samples were analyzed according to standard staining protocols and were stained for 30 minutes using the conjugated monoclonal antibodies shown in . After red blood cell lysis (RBC Lysis/Fixation solution; Biolegend) cells of the HCI cohort were analyzed on a Beckton Dickinson FACSCanto flow cytometer. UKE samples were analyzed with a reduced 5-color panel on a Beckman Coulter Navios flow cytometer. Plotted for both cytometers is Median intensity of arbitrary fluorescent units (MFI). Both cytometers use different analog to digital converters (ADC) and also have different laser and detector configurations, thus providing the relative different values of median intensities. Doublet cells were excluded by using FSC-H/FSC-A characteristics. Plasma cells (PC) were gated according to their CD138 and CD38 expression. Immunohistochemistry was performed on paraffin embedded formalin fixed bone marrow samples according to standard staining procedures. The slides were stained with anti CD229 antibody (clone 249936). (A) At 2 different centers, HCI (left) and UKE (right), BM samples of 7 (HCI) / 10 (UKE) patients with MGUS, 7 (HCI) patients with smoldering myeloma, 19 (HCI) / 30 (UKE) patients with multiple myeloma, 3 (UKE) patients with plasma cell leukemia, and 2 (HCI) healthy donors were analyzed by flow cytometry on CD138+CD38+ PC. (B) CD229 expression levels are shown as median fluorescence intensity (MFI) on CD138+CD38+ PC, CD45+CD19+ B cells, and other CD45+CD138-CD38- non-PC after doublet exclusion with a minimum of 100 acquired events within the respective gate. ***p < 0.001 using student's T test. (C) Positivity of BM plasma cells for CD229 IHC staining is indicated by brown color. Hematoxylin (blue color) was used as a counter stain to highlight nuclei and cytoplasm of haematopoietic cells. (Original magnification 500x). (D) Exemplary dot blot of BM-derived lymphocytes from one MM patient blotted against CD38 and CD229. The CD138+CD38+ PC population is highlighted in red.
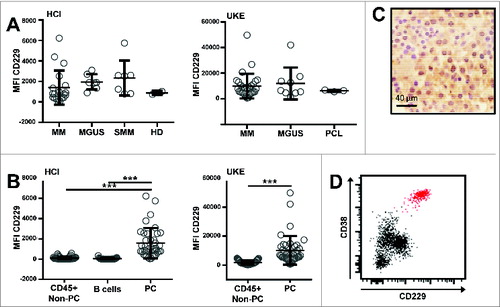
Figure 2. CD229 is expressed on abnormal plasma cells within the patients' bone marrow. PCs from 17 patients with MM, SMM, or MGUS were grouped according to the expression of (A) CD56 and CD19 or (B) CD28 and CD45 on their BM plasma cells. Exemplary dot blots are shown on the left. Normalized (subtracted from FMO control) median fluorescence intensity (nMFI) of CD229 is shown for the different PC subsets on the right. Only those samples were taken into account where clear populations were detectable and the number of events was greater than 50. Data are presented as mean ± SD. *p < 0.05, **p < 0.01.
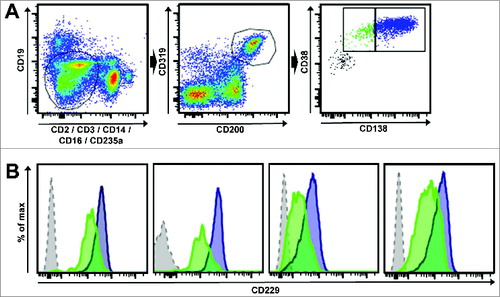
Figure 3. CD229 is expressed on myeloma-propagating cells including pre-PCs. (A) An exemplary gating scheme for myeloma-propagating cells is shown. After doublet exclusion the gate was set on CD19-, CD2-, CD3-, CD14-, CD16-, CD235a- cells (left) and cells were then gated for CD200+CD319+ (middle). Myeloma-propagating cells (right) were differentiated into CD38+CD138high (blue, PC) and CD38+CD138low/negative (green, pre-PCs) as previously described.Citation4 (B) Histograms show the expression levels of CD229 in 4 different MM patients. The blue histogram represents CD38+CD138high PC and the green histogram shows CD38+CD138low/negative pre-PCs. The gray histogram represents the FMO control gated on CD319+CD200+ cells. Results show that CD138-positive PC as well as CD138-negative pre-PC myeloma-propagating cells expressed similarly high levels of surface molecule CD229.