1,273
Views
6
CrossRef citations to date
0
Altmetric
Research Papers

Immunogenicity of a novel enhanced consensus DNA vaccine encoding the leptospiral protein LipL45

, , , , , , & show all
Pages 1945-1953 | Received 22 Dec 2014, Accepted 28 Apr 2015, Published online: 11 Aug 2015

Figures & data

Figure 1. Strategies utilized for LipL45 plasmid generation and confirmation of expression. (A) Schematic representation of plasmid map containing LipL45 gene, Kozak and IgE leader sequence along with restriction endonuclease sites. (B) Agarose electrophoresis gel photo indicating the LipL45 construct in the pVax1 expression vector. Lane 1: pLipL45 undigested DNA; Lane 2: LipL45 construct with single digestion of construct with KpnI; Lane 3: KpnI & NotI double digestion of the construct which releases the insert (1227bp): Lane 4: 1 kb control size markers. (C) Western blot analysis of pLipL45 expression. The expression of pLipL45 protein was analyzed 2 d post transfection by Western blotting using sera from the pLipL45 DNA vaccinated mice at 1:100 dilutions.
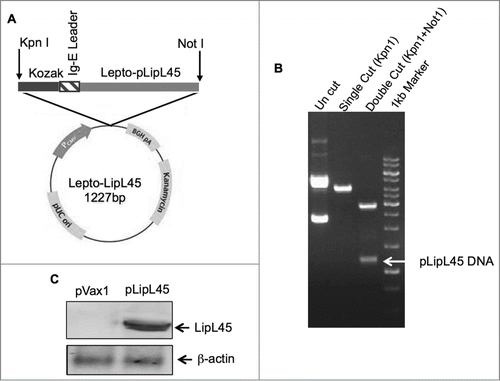
Figure 1. Strategies utilized for LipL45 plasmid generation and confirmation of expression. (A) Schematic representation of plasmid map containing LipL45 gene, Kozak and IgE leader sequence along with restriction endonuclease sites. (B) Agarose electrophoresis gel photo indicating the LipL45 construct in the pVax1 expression vector. Lane 1: pLipL45 undigested DNA; Lane 2: LipL45 construct with single digestion of construct with KpnI; Lane 3: KpnI & NotI double digestion of the construct which releases the insert (1227bp): Lane 4: 1 kb control size markers. (C) Western blot analysis of pLipL45 expression. The expression of pLipL45 protein was analyzed 2 d post transfection by Western blotting using sera from the pLipL45 DNA vaccinated mice at 1:100 dilutions.

Figure 2. Vaccination regimen and measurement of cellular immune responses. (A) Balb/C mice were immunized intramuscularly 3 times biweekly with 100 μg of pLipL45. Splenocytes were isolated from groups of 2 mice 1 week after the last vaccination. (B) Measurement of IFN-γ levels in pooled splenocytes pLipL45 or pVax1 vaccinated mice. Specifically, splenocytes were stimulated by individual LipL45 peptide pools followed by ELISpot assay analysis, measuring the production of IFN-γ spot forming cells (SFC). Experiments were performed twice with similar results and error bars indicated are the standard error of the mean. (C and D) Direct measurement of IFN-γ   and IL-12 cytokine production by splenocyte cultures from vaccinated mice. Specifically, levels of IFN-γ (C) or IL-12p70 (D) were measured in supernatants from spleen cell cultures of mice vaccinated with pLipL45 or control pVax1 vector and restimulated in vitro with 50 μg of the LipL45 peptide pools. Cytokine production by the unstimulated cells was subtracted from that by the stimulated cells in each experiment. Splenocytes were collected from 4 mice per group one week after the final immunization to detect the levels of IFN-γ and IL-12 p70. The experiment was repeated yielding similar results. Data from 2 independent experiments were included in the analysis. Data are expressed as mean ± SD. Statistically significant differences (P < 0.0001) in levels of the cytokines were apparent, when compared with the negative control.
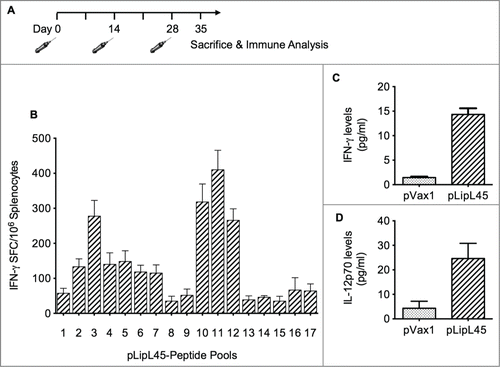
Figure 2. Vaccination regimen and measurement of cellular immune responses. (A) Balb/C mice were immunized intramuscularly 3 times biweekly with 100 μg of pLipL45. Splenocytes were isolated from groups of 2 mice 1 week after the last vaccination. (B) Measurement of IFN-γ levels in pooled splenocytes pLipL45 or pVax1 vaccinated mice. Specifically, splenocytes were stimulated by individual LipL45 peptide pools followed by ELISpot assay analysis, measuring the production of IFN-γ spot forming cells (SFC). Experiments were performed twice with similar results and error bars indicated are the standard error of the mean. (C and D) Direct measurement of IFN-γ   and IL-12 cytokine production by splenocyte cultures from vaccinated mice. Specifically, levels of IFN-γ (C) or IL-12p70 (D) were measured in supernatants from spleen cell cultures of mice vaccinated with pLipL45 or control pVax1 vector and restimulated in vitro with 50 μg of the LipL45 peptide pools. Cytokine production by the unstimulated cells was subtracted from that by the stimulated cells in each experiment. Splenocytes were collected from 4 mice per group one week after the final immunization to detect the levels of IFN-γ and IL-12 p70. The experiment was repeated yielding similar results. Data from 2 independent experiments were included in the analysis. Data are expressed as mean ± SD. Statistically significant differences (P < 0.0001) in levels of the cytokines were apparent, when compared with the negative control.

Figure 3. Increased frequencies of memory Tcells following immunization with pLipL45. (A) Representative FACS plots measuring effector memory (TEM) and central memory (TCM) CD8+T cells from pLipL45 immunized mice. One week after the last immunization with pLipL45 or the empty vector pVax1, spleen cells from 4 Balb/c mice were cultured in the presence of pooled LipL45 peptides. Splenocytes from immunized mice were stained with surface markers CD3 (APC), CD8 (PerCP), CD44 (FITC) and CD62L (PE), which are appropriate for assessing effector and central T cell memory responses. (B) Simultaneous assessment of analysis of CD44 and CD62L expression was determined on gated CD3+CD8+ cells. Effector (CD44hi CD62Llow) T cell levels are depicted. Cells (105) from mice immunized with pVax1 or pLipL45 (n = 4) were stained, gated and analyzed using FlowJo software. Samples from individual mice were analyzed and values are expressed as mean± SE.
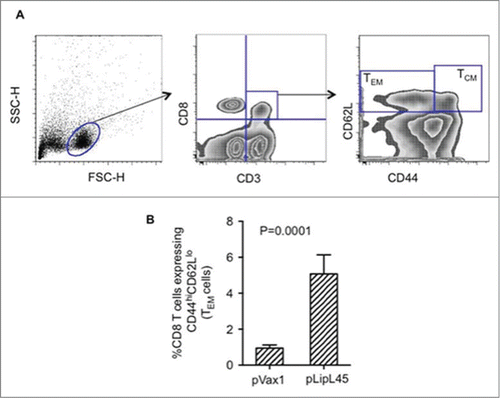
Figure 3. Increased frequencies of memory Tcells following immunization with pLipL45. (A) Representative FACS plots measuring effector memory (TEM) and central memory (TCM) CD8+T cells from pLipL45 immunized mice. One week after the last immunization with pLipL45 or the empty vector pVax1, spleen cells from 4 Balb/c mice were cultured in the presence of pooled LipL45 peptides. Splenocytes from immunized mice were stained with surface markers CD3 (APC), CD8 (PerCP), CD44 (FITC) and CD62L (PE), which are appropriate for assessing effector and central T cell memory responses. (B) Simultaneous assessment of analysis of CD44 and CD62L expression was determined on gated CD3+CD8+ cells. Effector (CD44hi CD62Llow) T cell levels are depicted. Cells (105) from mice immunized with pVax1 or pLipL45 (n = 4) were stained, gated and analyzed using FlowJo software. Samples from individual mice were analyzed and values are expressed as mean± SE.

Figure 4. Measurement of anti-LipL45 specific antibody immune responses after pLipL45 vaccination. Following immunization of female BalbC mice with pLipL45 antigen specific humoral immune responses were measured. The quantitation was made one week after the final immunization. (A) Specific OD450nm ± SD values in pLipL45 and control pVax1 vaccinated mice as a function of sera dilution. (B) Ratio of antigen specific IgG2a/IgG1 levels measured in sera from pLipL45 from pVax1 vaccinated mice one week after the final immunization. The total number of mice in the analysis described for (A) and (B) above was 4. (C) Binding, measured by ELISA, sera from antibodies pLipL45 immunized mice to different LipL45 peptide pools identified a dominant MHC II LipL45 epitope.
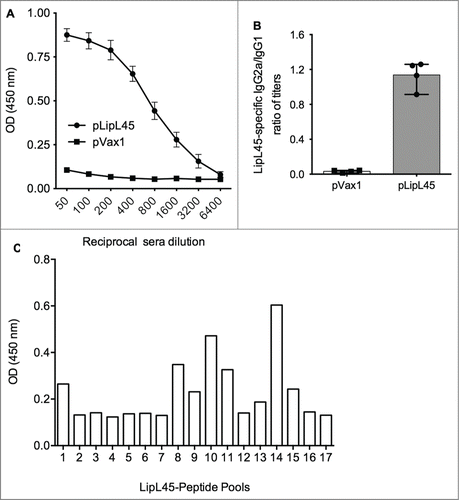
Figure 4. Measurement of anti-LipL45 specific antibody immune responses after pLipL45 vaccination. Following immunization of female BalbC mice with pLipL45 antigen specific humoral immune responses were measured. The quantitation was made one week after the final immunization. (A) Specific OD450nm ± SD values in pLipL45 and control pVax1 vaccinated mice as a function of sera dilution. (B) Ratio of antigen specific IgG2a/IgG1 levels measured in sera from pLipL45 from pVax1 vaccinated mice one week after the final immunization. The total number of mice in the analysis described for (A) and (B) above was 4. (C) Binding, measured by ELISA, sera from antibodies pLipL45 immunized mice to different LipL45 peptide pools identified a dominant MHC II LipL45 epitope.

Reprints and Corporate Permissions

Please note: Selecting permissions does not provide access to the full text of the article, please see our help page How do I view content?

To request a reprint or corporate permissions for this article, please click on the relevant link below:

Academic Permissions

Please note: Selecting permissions does not provide access to the full text of the article, please see our help page How do I view content?

Obtain permissions instantly via Rightslink by clicking on the button below:

If you are unable to obtain permissions via Rightslink, please complete and submit this Permissions form. For more information, please visit our Permissions help page.