Figures & data
Figure 1. Reduced antibody responses to HBsAg in B10.S mice. Adult female B10 and B10.S mice were immunized with 0.25, 0.50 or 1.0 µg of HBsAg together with aluminum adjuvant in 0.2 ml of normal saline. Blood samples were collected 4 weeks after vaccination, and (A) the total anti-HBs IgG levels were determined by ELISA. The mice were boosted with 0.25, 0.50 or 1.0 µg of HBsAg 4 weeks after the first vaccination. Blood samples were collected 2 weeks after boosting, and (B) the total anti-HBs IgG levels were determined by ELISA. B10 and B10.S mice were immunized with 2.0 µg of HBsAg, and blood samples were collected on day 0 (pre-immunization) and on days 7, 14, 21, and 28 after immunization. (C) The total anti-HBs IgG levels were determined by ELISA (**P< 0.01).
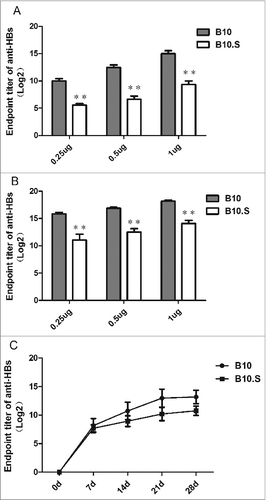
Figure 2. Normal antibody responses to influenza and tetanus vaccines and OVA in B10.S mice. Adult female B10 and B10.S mice were immunized with HA monovalent influenza vaccines (0.15 ug/dose), tetanus toxoid (2 µg/dose) or OVA (2 µg/dose) with aluminum adjuvant in 0.2 ml of normal saline. Blood samples were collected 4 weeks after immunization, and the level of antigen-specific antibodies (IgG) was determined by ELISA. The data shown are representative of 3 separate experiments.
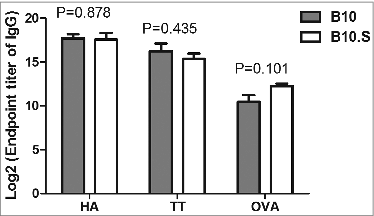
Figure 3. Impaired HBsAg-specific plasma cell response in B10.S mice. (A) Two weeks after boosting with HBsAg (2 µg/dose), splenocytes and bone marrow cells from B10 and B10.S mice were isolated. The number of HBsAg-specific IgG-secreting plasma cells was determined using B cell ELISPOT kits from MabTech. (B) The spots were counted using an ImmunoSpot analyzer, verified by counting with the naked eye and analyzed by ANOVA using the SPSS software. The data shown are representative of 3 separate experiments.
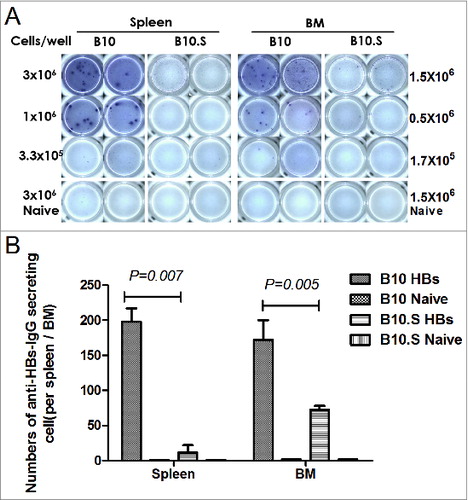
Figure 4. Impaired activation of HBsAg-specific CD4+ T cells in B10.S mice. Two weeks after boosting with HBsAg (2 µg/dose), the splenocytes of B10 and B10.S mice were isolated and treated with HBsAg (20 µg/ml). The cells were subjected to surface staining of CD4 combined with intracellular staining of IL-2 (A), IL-4 (B), IFN-γ (C), TNF-α (D) or IL-17(E). The percentages of cytokine-secreting CD4+ cells are shown, and the data are representative of 3 separate experiments.
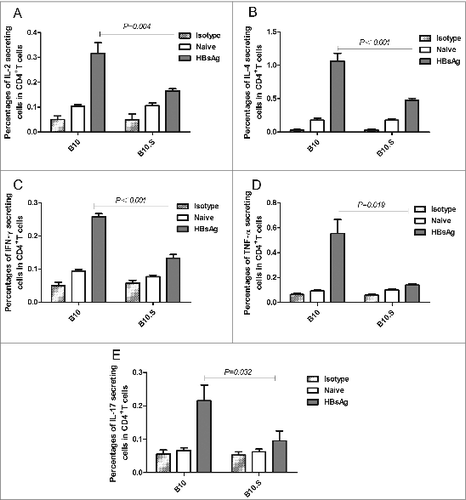
Figure 5. Impaired cytokine production in B10.S splenic cells. Two weeks after boosting with HBsAg (2 µg/dose), the splenocytes of B10 and B10.S mice were isolated and treated with HBsAg (20 µg/ml) for 24 h. The culture supernatants were collected, and the levels of IL-4 (A), IFN-γ (B), IL-10 (C), IL-12 (D), TNF-α (E) and IL-6 (F) were detected using specific ELISA kits. The data shown are representative of 3 separate experiments.
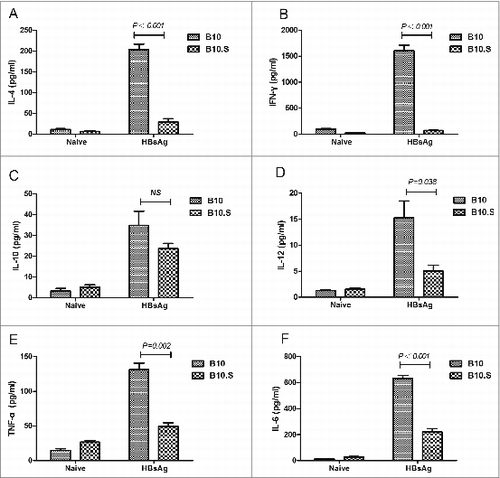
Figure 6. Reduced expression of surface markers on DC from B10.S mice after immunization with HBsAg. Three days after immunization with HBsAg (2 µg/dose), the draining inguinal lymph nodes from B10 and B10.S mice were removed, and single-cell suspensions were prepared. The cells were harvested, subjected to surface staining of CD11c, CD40, CD80, CD86 and CCR7 and analyzed by flow cytometry. The column graphs show the geometric mean fluorescence intensities of the surface markers as the means ± SD for each group of cells. LNDCs from unimmunized mice were used as controls.
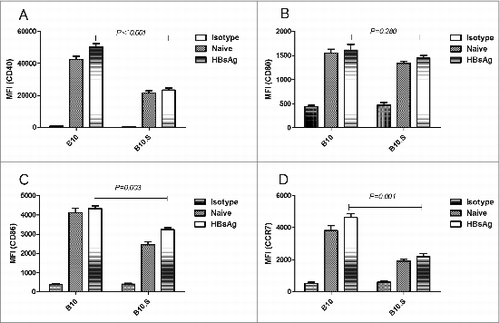
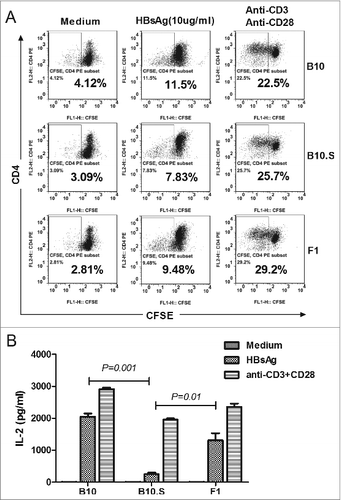
Figure 7. APCs from B10.S mice have impaired capacity to stimulate HBsAg-specific CD4+ T cell proliferation. (A) Ten days after boosting with HBsAg (2 µg/dose), CD4+ T cells from spleens of F1 mice (hybrid of C57BL/10 and B10.S-H2s/SgMcdJ mice) were negatively selected and labeled with CFSE. BMDCs from B10, B10.S or F1 mice were induced and co-cultured with CFSE-labeled CD4+ T cells at a ratio of 1:5 in 100 µl of medium containing HBsAg (10 µg/ml) or anti-CD3/CD28. After five days of culture, the cells and supernatants were collected. The cells were stained with PE-conjugated anti-CD4 mAb and analyzed by flow cytometry. (B) The murine IL-2 levels in the culture supernatants were measured by ELISA.