Figures & data
Figure 1. The experimental plan. Two hundred and thirty seven healthcare workers were vaccinated with the 2009 A(H1N1)pdm09 monovalent split virus vaccine (3.75 μg HA) formulated with the oil-in-water adjuvant AS03. The figure shows the number of samples (n) analyzed at each sampling day (Day) for each immunological assay and the H1N1 strains against which the assays were performed. Consecutive blood samples were taken from the same subject at 4 time points (day 0 7, 14 and 21 post-vaccination) for HI, SRH, ASC, memory B cell and IFN-γ ELISPOT assays. For ICS, PBMCs were obtained from 8 subjects before vaccination and a separate cohort of 18 subjects on day 21 post-vaccination. The ASC (n = 39) and ICS (n = 8–18) assays were run on fresh PBMCs, whereas memory B cell (n = 16–27), and IFN-γ ELISPOT (n = 9) assays were run on freeze/thawed PBMCs. * Strains used in the SRH assay.
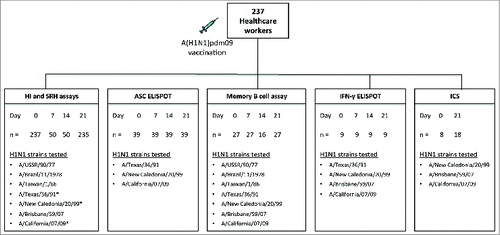
Figure 2. Homologous and cross-reactive haemagglutinin inhibition response after pandemic vaccination. The HI response against the homologous vaccine virus A/California/07/09 and 6 seasonal influenza H1N1 strains A/USSR/90/77, A/Brazil/11/1978, A/Taiwan/1/86, A/Texas/36/91, A/New Caledonia/20/99 and A/Brisbane/59/07 was determined before vaccination (day 0) and at 7, 14 and 21 days after vaccination. The bars show the geometric mean titer with 95% confidence interval and individual responses are presented as symbols. The dotted horizontal line represents a sero-protective HI titer of 40.
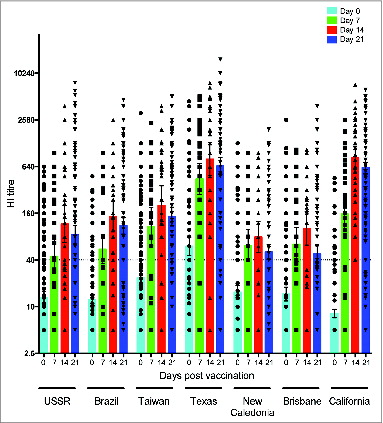
Figure 3. Homologous and cross-reactive single radial hemolysis (SRH) antibody responses after pandemic vaccination. The SRH response against the homologous vaccine strain A/California/7/09 and 2 seasonal influenza strains A/Texas/36/91 and A/New Caledonia/20/99 was determined before vaccination (day 0) and at 7, 14 and 21 days after vaccination. Each symbol represents the SRH titer of one subject, with geometric means and 95% confidence levels indicated. The dotted horizontal line shows the sero-protective SRH titer of 25 mm2.
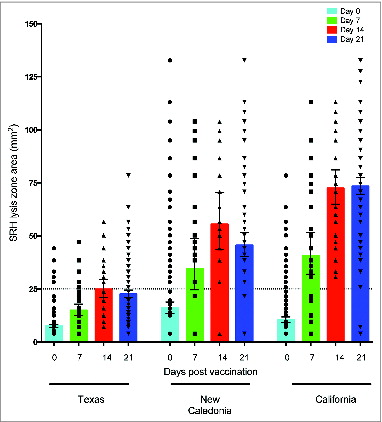
Figure 4. The antibody secreting cell response 7 days after pandemic vaccination. The A/Texas/36/91, A/New Caledonia/20/99 and A/California/07/09-specific IgG, IgA and IgM ASC responses were measured by ELISPOT 7 days after vaccination with AS03-adjuvaned pandemic H1N1 vaccine. The bars represent mean numbers of virus-specific ASCs per 100 000 peripheral blood mononuclear cells (PBMC) ± standard error of the mean. Statistical differences are shown by non-parametric Kruskal-Wallis test. ** = P < 0.01, *** = P < 0.001, **** = P < 0.0001.
Figure 5. Homologous and cross-reactive memory B cells responses after pandemic vaccination. The pre- and post-vaccination IgG memory B cell responses were determined against the homologous vaccine strain A/California/07/09 and cross-reactive responses against 6 seasonal influenza strains A/USSR/90/77, A/Brazil/11/1978, A/Taiwan/1/86, A/Texas/36/91, A/New Caledonia/20/99 and A/Brisbane/59/07. The vertical bars represent the mean ± standard error of the mean and each symbol represents one subject.
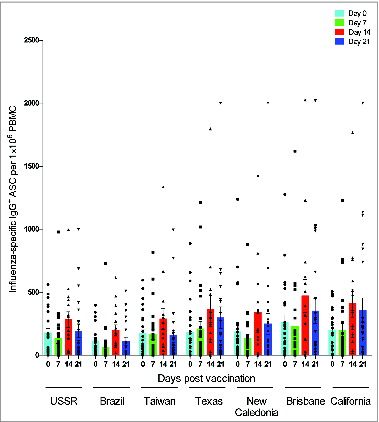
Table 1. Correlation between memory B cell responses to vaccine virus and seasonal H1N1 virus pre- and post-vaccination
Figure 6. IFN-γ responses against influenza A virus strains after pandemic vaccination. Peripheral blood mononuclear cells (PBMC) obtained from individuals vaccinated with AS03-adjuvanted pandemic H1N1 vaccine were stimulated overnight with split virus antigens from the homologous vaccine virus A/California/7/09 and seasonal H1N1 strains A/Texas/36/91, A/New Caledonia/20/99 and A/Brisbane/59/07 and the IFN-γ response was evaluated by the ELISPOT assay. Each symbol represents one subject and with mean and standard error of the mean indicated.
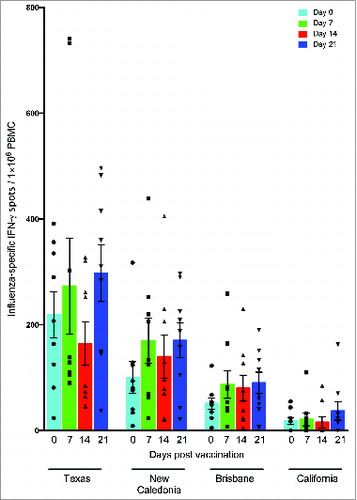
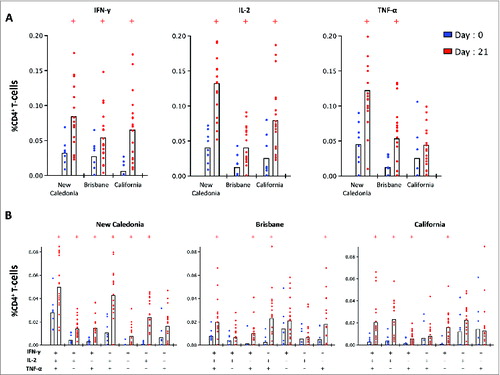
Figure 7. The single (A) and multi-functional (B) CD4+ T-cell cytokine response before and 21 days after pandemic vaccination. Peripheral blood mononuclear cells (PBMC) were obtained from 8 subjects before vaccination (day 0) and from a separate cohort of 18 subjects on day 21 post-A(H1N1)pdm09 vaccination. PBMCs were stimulated overnight with split virus antigens from A/New Caledonia/20/99, A/Brisbane/59/07 and A/California/07/09 viruses and stained for intracellular cytokines (IFN-γ, IL-2 and TNF-α) and the percentage of single cytokine producing (A) or muli-functioal (B) CD4 T-cells was measured by flow cytometry. +group (day 21) significantly different by Student t test from day 0 (P < 0.05).