Figures & data
Figure 1. Selected survivin peptides induce production of Interferon γ in (T)cells isolated from naïve healthy donors. Blood monocyte-derived dendritic cells (DC), cultured from 10 healthy human donors were pulsed with survivin peptides (Hsurv 1–7) and used in co-culture experiments with autologous T cells. Intracellular IFN-γ in T cells was evaluated by flow cytometric analyses. (A) Percentages of IFN-γ expressing CD3+ T cells induced by each survivin peptide. DC loaded with an irrelevant peptide or not pulsed with any peptide were used to stimulate T cells as controls. Data are presented as mean of IFN-γ+ CD3+ T cells ± SE, with means from “Hsurv” conditions compared with control “No Pep” using a Student's t-test and significance at *P < 0.05, **P < 0.1. (B) Representative data from flow cytometric analysis of IFN-γ expressing CD3+ T cells. T cells were pulsed with DC not loaded (No Pep) or stimulated with Hsurv6 peptide.
Table 1. List of survivin peptides evaluated in DC-T cell co-cultures
Figure 2. Autologous dendritic cells loaded with survivin peptides induce activation of CD4+ and CD8+ (T)cells. Blood monocyte-derived dendritic cells (DC) were pulsed with survivin peptides and used in co-culture experiments with autologous T cells. Intracellular IFN-γ in CD4+ and CD8+ T cells was evaluated by flow cytometric analyses. (A) Top. Percentages of IFN-γ expressing CD4+ T cells induced by survivin peptides designed for MHC-II (Hsurv 1–3). Donor haplotype: HLA DRB1 11:02, 15:03. DC loaded with an irrelevant peptide or not pulsed with any peptide were used to stimulate T cells as controls. Data are presented as mean of IFN-γ+ CD4+ T cells ± SE, with means compared using a Student's t-test and significance at *P < 0.05; Bottom. Representative data from flow cytometric analysis of IFN-γ expressing CD4+ T cells. T cells were pulsed with DC not loaded (No Pep) or stimulated with Hsurv2 peptide. (B) Top. Percentages of IFN-γ expressing CD8+ T cells induced by survivin peptides designed for MHC-I (Hsurv 4–7). Donor haplotype: HLA A 68:01, 26:01; HLA B 35:01, 51:01. Data are presented as mean of IFN-γ+ CD8+ T cells ± SE, with means compared using a Student's t-test and significance at *P < 0.05; Bottom. Representative data from flow cytometric analysis of IFN-γ expressing CD8+ T cells. T cells were pulsed with DC not loaded (No Pep) or stimulated with Hsurv5 peptide.
Table 2. T cell responses after co-culture with DC loaded with Hsurv peptides
Table 3. T cell responses after co-culture with DC loaded with Hsurv peptides pools
Figure 3. Survivin epitopes have been included in HIvax1 e HIvax2. (A) HIvax 1 and 2 diagrams. Epitopes from Hsurv 5–7 were included in HIvax1, separated by AAY spacers and targeted to the ER by including an IgK signal sequence. This strategy facilitates the correct presentation of these peptides on MHC-I. For HIvax2, epitopes from Hsurv 1–3 were separated by GPGPG spacers and fused with a plasminogen activator signal sequence (tPA) to facilitate presentation on MHC-II. (B) Detection of specific RNAs produced by DC infected with HIvax. RT-PCR was performed on RNA extracted from DC infected with HIvax1 or HIvax2, using primers specific for HIvax1 or HIvax2 transgenes. Positive control: DNA from HIvax vectors. Negative control: cDNA made from RNA from FP-ctrl infected DC. (C) Immunofluorescence staining to detect V5 in DC infected with FP-ctrl or HIvax. Fluorochrome-conjugated antibodies were used to detect V5 and the cell nuclei counterstained with propidium iodide. (D) Peptides produced by HIvax1 and HIvax2 are differentially processed and loaded into MHCs: (1) Antigens produced from HIvax1 RNA are processed by ER-resident peptidases and peptides mounted on MHC-I. These molecules are then transported to the plasma membrane for presentation to CD8+ T cells; (2) Polypeptide encoded by the HIvax2 transgene is secreted, re-engulfed and degraded in lysosomes. Resultant peptides are mounted on MHC-II and transported to the plasma membrane for presentation to CD4+ T cells; (3) Prematurely truncated or abnormally folded proteins produced by both HIvax1 and HIvax2 are exported to the cytosol, ubiquitinated and processed by the proteasome. Resultant peptides are transported back in the ER and loaded on MHC of class I. Peptides resulting from proteasome cleavage may be also mounted on MHC of class II with a mechanism that does not require TAP or ER transportation.
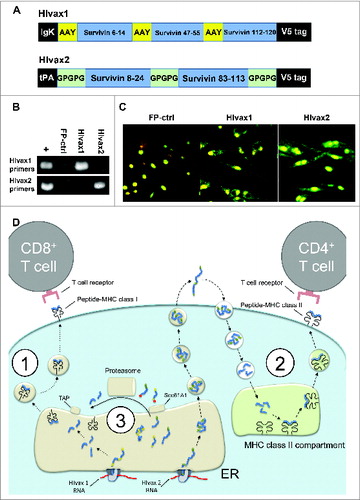
Figure 4. HIvax1 and HIvax2 induce activation of CD8+ and CD4+ T cells, respectively, in a donor with haplotype HLA-A 01:01, 11:01; HLA-B 08:01, 42:01; HLA-DRB1 03:01. Human dendritic cells (DC) were infected with HIvax1 or HIvax2 and co-cultured for 2 wks with autologous T cells. T cells were then pulsed with new DC, not loaded or loaded with pool of survivin peptides and evaluated for intracellular IFN-γ by flow cytometric analyses. (A) Top. Percentages of IFN-γ expressing CD8+ T cells induced by DC infected with Fp-ctrl or HIvax1. DC not loaded or loaded with the pool of peptides expressed by HIvax1, were used to activate T cells before the analyses. Data are presented as mean of IFN-γ+ CD8+ T cells ± SE, with means compared using a Student's t-test and significance at *P< 0.05; Bottom. Representative data from flow cytometric analysis of IFN-γ expressing CD8+ T cells generated with HIvax1. T cells were pulsed with DC not loaded or loaded with the pool Hsurv 5,6,7. (B) Top. Percentages of IFN-γ expressing CD4+ T cells induced with Fp-ctrl or HIvax2. DC not loaded or loaded with the pool of peptides expressed by HIvax2, were used to pulse T cells before the cytometric analyses. Data are presented as mean of IFN-γ+ CD4+ T cells ± SE, with means compared using a Student's t-test and significance at *P < 0.05; Bottom. Representative data from flow cytometric analysis of IFN-γ expressing CD4+ T cells generated with HIvax2. T cells were pulsed with DC not loaded or loaded with the pool Hsurv 1,2,3.
Figure 5. Cytolytic potential of HIvax-activated (T)cells against malignant mesothelioma cells overexpressing survivin. (A) ELISPOT analysis of released granzyme B was performed after stimulation by DC infected with FP-ctrl or HIvax1/HIvax2 simultaneously (HIvax). T cells were co-cultured for 4 h with ADA human malignant mesothelioma (MM) cells or primary fibroblasts. Results shown are numbers of spots per 104 T cells. Bars correspond to the mean ± SE of results obtained from 2 individual experiments, with means compared using a Student's t-test and significance at *P < 0.05. (B) Western blot analysis of lysates from primary fibroblasts and ADA MM cells to detect Survivin. Equal loading was compared using anti-αtubulin antibodies.