1,020
Views
9
CrossRef citations to date
0
Altmetric
Research Paper

A chimeric protein comprising the glucosyltransferase and cysteine proteinase domains of toxin B and the receptor binding domain of toxin A induces protective immunity against Clostridium difficile infection in mice and hamsters

, , , , , , & show all
Pages 2215-2222 | Received 31 Oct 2014, Accepted 14 May 2015, Published online: 08 Aug 2015

Figures & data

Figure 1. Domains of TcdA and TcdB and construction of mTcd138. (A) Both toxins share similar domains, including the glucosyltransferase domain (GT), the autocatalytic cysteine proteinase domain (CPD), the translocation domain (TMD) and the receptor binding domain (RBD). The DXD motif and a conserved tryptophan in the GT are involved in the enzymatic activity. (B) mTcd138 was constructed by fusing the GT and CPD of TcdB with the RBD of TcdA. Two point mutations were made in the GT of TcdB to eliminate the toxicity of mTcd138.
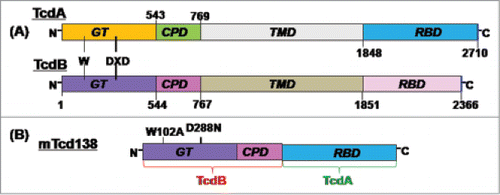
Figure 1. Domains of TcdA and TcdB and construction of mTcd138. (A) Both toxins share similar domains, including the glucosyltransferase domain (GT), the autocatalytic cysteine proteinase domain (CPD), the translocation domain (TMD) and the receptor binding domain (RBD). The DXD motif and a conserved tryptophan in the GT are involved in the enzymatic activity. (B) mTcd138 was constructed by fusing the GT and CPD of TcdB with the RBD of TcdA. Two point mutations were made in the GT of TcdB to eliminate the toxicity of mTcd138.

Figure 2. Expression and purification of mTcd138. Analysis of purified 138 kDa fusion protein by SDS-PAGE (A) and Western blot analysis with anti-TcdA antibody (B) and anti-TcdB antibody (C).
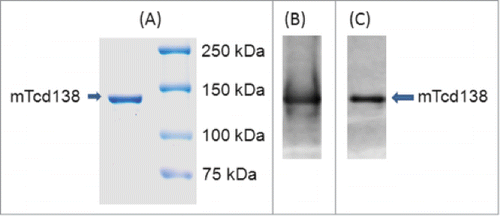
Figure 2. Expression and purification of mTcd138. Analysis of purified 138 kDa fusion protein by SDS-PAGE (A) and Western blot analysis with anti-TcdA antibody (B) and anti-TcdB antibody (C).

Figure 3. Toxicity of mTcd138. (A) Vero cells in a 96-well plate were exposed to TcdA, TcdB or mTcd138 at different concentrations for 72 h. MTT assays were performed, and cell viability was expressed as the percentage of surviving cells compared to cells without toxin exposure. (B) Vero cells were treated with TcdA, TcdB, or mTcd138 at the indicated doses for 72 hours, and representative cell images were taken. (C) C57/BL6 mice were intraperitoneally challenged with 100 ng of TcdA or TcdB or 100 μg of mTcd138. Mouse survival was monitored for 80 hours.
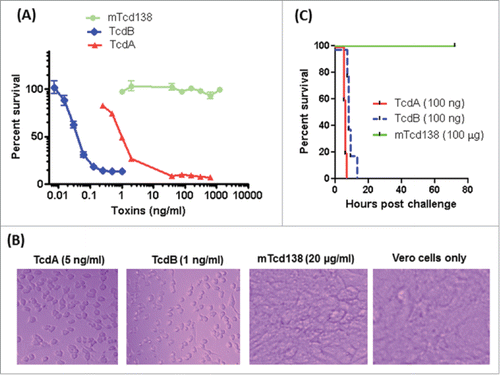
Figure 3. Toxicity of mTcd138. (A) Vero cells in a 96-well plate were exposed to TcdA, TcdB or mTcd138 at different concentrations for 72 h. MTT assays were performed, and cell viability was expressed as the percentage of surviving cells compared to cells without toxin exposure. (B) Vero cells were treated with TcdA, TcdB, or mTcd138 at the indicated doses for 72 hours, and representative cell images were taken. (C) C57/BL6 mice were intraperitoneally challenged with 100 ng of TcdA or TcdB or 100 μg of mTcd138. Mouse survival was monitored for 80 hours.

Figure 4. mTcd138 immunization via intraperitoneal (i.p.), intramuscular (i.m.) or intradermal (i.d.) route induces similar levels of antibody response. Groups of C57 BL/6 mice were immunized 3 times at 14-day intervals via i.p., i.m. or i.d. route with 10 µg of mTcd138 in the presence of alum (i.m. and i.p.) or double mutant E.coli heat labile toxin (dmLT) (i.d.) as an adjuvant. Sera were collected, and anti-TcdA (A) or anti-TcdB (B) IgG titers measured by standard ELISA.
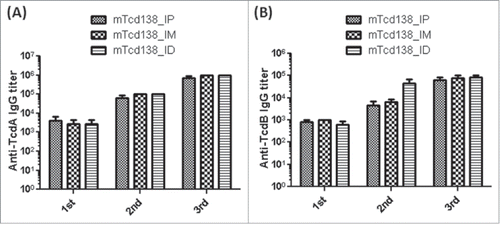
Figure 4. mTcd138 immunization via intraperitoneal (i.p.), intramuscular (i.m.) or intradermal (i.d.) route induces similar levels of antibody response. Groups of C57 BL/6 mice were immunized 3 times at 14-day intervals via i.p., i.m. or i.d. route with 10 µg of mTcd138 in the presence of alum (i.m. and i.p.) or double mutant E.coli heat labile toxin (dmLT) (i.d.) as an adjuvant. Sera were collected, and anti-TcdA (A) or anti-TcdB (B) IgG titers measured by standard ELISA.

Figure 5. Serum anti-toxin neutralizing titers of the mTcd138-immunized mice (i.p.). Vero cells were used to determine in vitro neutralizing activities of sera. The neutralizing titer is expressed as the maximum dilution of the sera that inhibits cell rounding caused by toxin at a given concentration. This given concentration is the minimum toxin dose causing cell rounding after a 16 h of toxin exposure, i.e., 2.5 and 0.1 ng/ml for TcdA and TcdB, respectively.
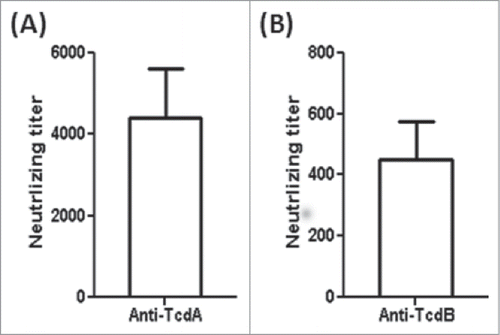
Figure 5. Serum anti-toxin neutralizing titers of the mTcd138-immunized mice (i.p.). Vero cells were used to determine in vitro neutralizing activities of sera. The neutralizing titer is expressed as the maximum dilution of the sera that inhibits cell rounding caused by toxin at a given concentration. This given concentration is the minimum toxin dose causing cell rounding after a 16 h of toxin exposure, i.e., 2.5 and 0.1 ng/ml for TcdA and TcdB, respectively.

Figure 6. mTcd138 immunization protects mice against systemic toxin challenge. Kaplan-Meier survival plot of mTcd138-immunized (i.p.) or control mice challenged with lethal dose of TcdA or TcdB (i.p.).
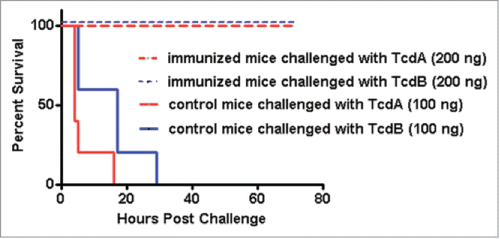
Figure 6. mTcd138 immunization protects mice against systemic toxin challenge. Kaplan-Meier survival plot of mTcd138-immunized (i.p.) or control mice challenged with lethal dose of TcdA or TcdB (i.p.).

Figure 7. mTcd138 immunization of mice via i.p, i.m. or i.d. routes provides full protection against infection with a hypervirulent C. difficile strain. Mice were challenged with C. difficile UK6 spores (106 /mouse) 14 days after the third immunization with mTcd138 or PBS. Kaplan-Meier survival plots (P = 0.0384 between PBS-immunized and the 3 mTcd138-immunized groups) (A), mean relative weight of all surviving mice (up to the day of death) (B) of different groups, and frequency of diarrhea (C) are illustrated. Data were presented as mean relative weight ± standard error.
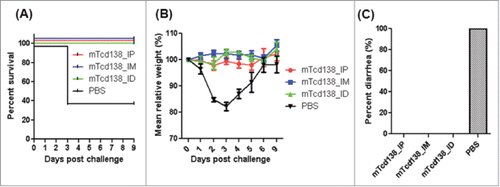
Figure 7. mTcd138 immunization of mice via i.p, i.m. or i.d. routes provides full protection against infection with a hypervirulent C. difficile strain. Mice were challenged with C. difficile UK6 spores (106 /mouse) 14 days after the third immunization with mTcd138 or PBS. Kaplan-Meier survival plots (P = 0.0384 between PBS-immunized and the 3 mTcd138-immunized groups) (A), mean relative weight of all surviving mice (up to the day of death) (B) of different groups, and frequency of diarrhea (C) are illustrated. Data were presented as mean relative weight ± standard error.

Figure 8. Protective response of mTcd138 vaccination in hamsters. (A) Serum anti-TcdA/TcdB IgG titers after each immunization with mTcd138 (10 µg, IP); (B) Serum (from 3rd immunization) anti-TcdA neutralizing titers; (C) Serum (from 3rd immunization) anti-TcdB neutralizing titers; (D) Kaplan-Meier survival curves of mTcd138-immunized or PBS-immunized hamsters challenged with 2 × 10⁵ C. difficile UK6 spores (P = 0.0075).
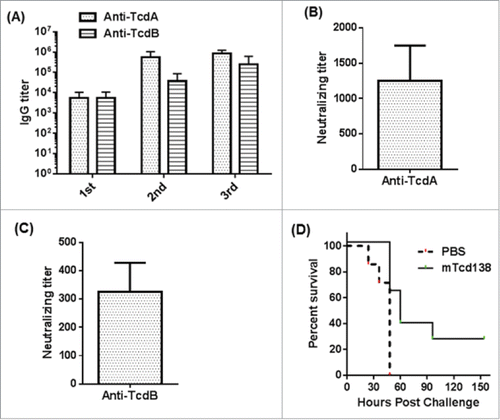
Figure 8. Protective response of mTcd138 vaccination in hamsters. (A) Serum anti-TcdA/TcdB IgG titers after each immunization with mTcd138 (10 µg, IP); (B) Serum (from 3rd immunization) anti-TcdA neutralizing titers; (C) Serum (from 3rd immunization) anti-TcdB neutralizing titers; (D) Kaplan-Meier survival curves of mTcd138-immunized or PBS-immunized hamsters challenged with 2 × 10⁵ C. difficile UK6 spores (P = 0.0075).