1,571
Views
14
CrossRef citations to date
0
Altmetric
Commentary

Neural immune modulation and immunotherapy assisted by focused ultrasound induced blood-brain barrier opening

, &
Pages 2682-2687 | Received 22 Jun 2015, Accepted 08 Jul 2015, Published online: 17 Sep 2015

Figures & data

Figure 1. Schematic showing FUS-induced BBB opening with its potential effect in CNS immune modulation and immunotherapy.
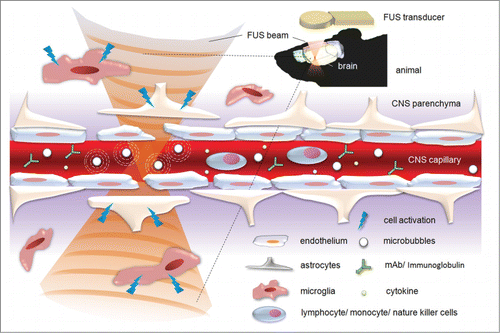
Figure 1. Schematic showing FUS-induced BBB opening with its potential effect in CNS immune modulation and immunotherapy.

Figure 2. Glial Fibrillary Acidic Protein (GFAP) immunofluorescence, neuronal nuclei (NeuN), and HE staining in the contralateral (A, B, C) and in the FUS-BBB opened brain (D, E, F). Neuron distributions (nuclei stained by NeuN; B and E) appeared similar on both sides of the brain, but concentrations of activated glial cells (stained by GFAP; A and D) were increased in the experimental lateral brain. HE-staining (C and F) showed that the tissue structure was not severely damaged by FUS treatment. Bar = 200 μm.
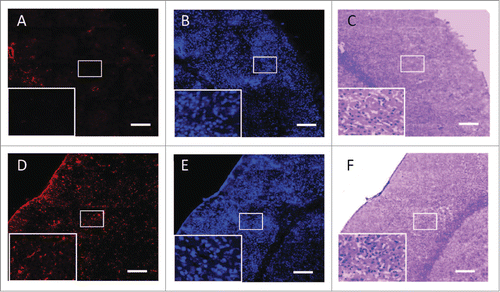
Figure 2. Glial Fibrillary Acidic Protein (GFAP) immunofluorescence, neuronal nuclei (NeuN), and HE staining in the contralateral (A, B, C) and in the FUS-BBB opened brain (D, E, F). Neuron distributions (nuclei stained by NeuN; B and E) appeared similar on both sides of the brain, but concentrations of activated glial cells (stained by GFAP; A and D) were increased in the experimental lateral brain. HE-staining (C and F) showed that the tissue structure was not severely damaged by FUS treatment. Bar = 200 μm.

Figure 3. Representative fluorescent IHC analysis shows lymphocyte infiltration in the brain tumor and the corresponding lymphocyte population changes (particularly Treg and CTL populations). (A) Untreated brain tumor; (B) brain tumor treated with FUS-induced BBB opening; (C) brain tumor treated by IP IL-12 administration; (D) combined FUS with IL-12 administration, showing the enriched CTL infiltration and CTL/Treg ratio increase. Green: CD4+CD25+ lymphocytes (Treg); Red: CD3+CD8+ lymphocytes (CTL); Blue: DAPI-stained cell nucleus. Bar = 50 μm.
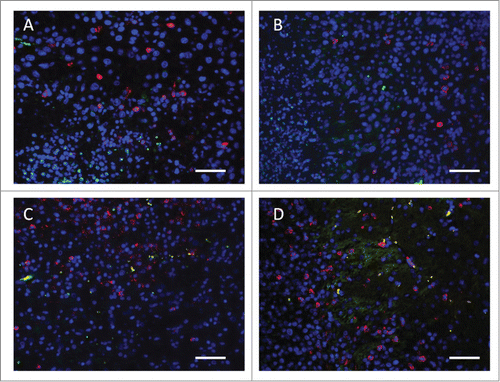
Figure 3. Representative fluorescent IHC analysis shows lymphocyte infiltration in the brain tumor and the corresponding lymphocyte population changes (particularly Treg and CTL populations). (A) Untreated brain tumor; (B) brain tumor treated with FUS-induced BBB opening; (C) brain tumor treated by IP IL-12 administration; (D) combined FUS with IL-12 administration, showing the enriched CTL infiltration and CTL/Treg ratio increase. Green: CD4+CD25+ lymphocytes (Treg); Red: CD3+CD8+ lymphocytes (CTL); Blue: DAPI-stained cell nucleus. Bar = 50 μm.

Reprints and Corporate Permissions

Please note: Selecting permissions does not provide access to the full text of the article, please see our help page How do I view content?

To request a reprint or corporate permissions for this article, please click on the relevant link below:

Academic Permissions

Please note: Selecting permissions does not provide access to the full text of the article, please see our help page How do I view content?

Obtain permissions instantly via Rightslink by clicking on the button below:

If you are unable to obtain permissions via Rightslink, please complete and submit this Permissions form. For more information, please visit our Permissions help page.