Figures & data
Figure 1. ISM expression completely abolishes the tumorigenicity of D2F2/E2 cells and induce partial protective immune responses following secondary tumor challenge. (A) Surface expression of HER-2 and B7-1, GPI-IL-12, GPI-GM-CSF on D2F2/E2 cells, Gray histogram (isotype control). (B) Mice were directly challenged with 2 × 10⁵ live D2F2/E2 wild-type (WT) cells or live cells adjuvanted with B7-1, GPI-IL-12 or GPI-GM-CSF. (C) Primary tumor growth curve and tumor free survival is shown (D) Serum collected prior to secondary challenge was diluted (1:250) and used to assess for HER-2 specific IgG antibodies using WT cells by a cell ELISA as described in Materials and Methods. (E) Tumor-free mice were subjected to a secondary challenge 5 weeks after primary challenge with 2 × 10⁵ live WT cells on the contralateral flank. Tumor growth and tumor free survival was monitored. Mean ± SEM is plotted. Representative data from 2 individual experiments (n=5 per group) is shown. Significance relative to WT, *p < 0.05, **p < 0.01, ***p < 0.001, **** p < 0.0001
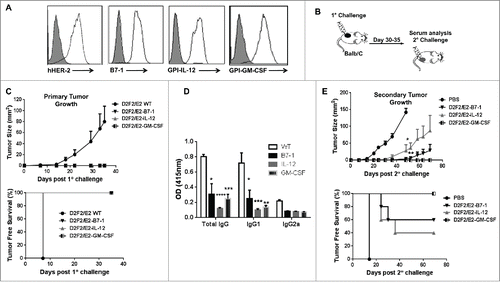
Figure 2. Analysis of circulating levels of IL-12 and GM-CSF in mice challenged with D2F2/E2 cells expressing GPI-GM-CSF and GPI-IL-12. Serum and plasma was collected from mice 24hrs post challenge with 2 × 10⁵ or 4×10⁵ D2F2/E2 live cells adjuvanted with GPI-IL-12 or GPI-GM-CSF. Cytokine levels were quantified by a sandwich ELISA. Mean ± SEM is plotted (n = 3–5 mice/group).
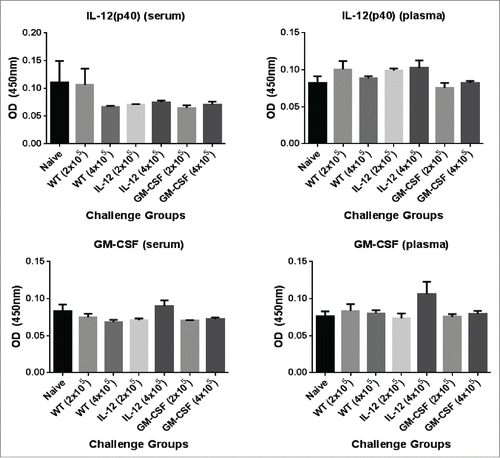
Figure 3. Prophylactic vaccination with B7-1 and GPI-IL-12 adjuvanted cellular vaccines led to complete protection against subsequent D2F2/E2 tumor challenge. (A) Two weeks after vaccination (s.c.) with irradiated cellular vaccines expressing GPI-ISMs (2 × 10⁵) mice were challenged (s.c.) with 2 × 10⁵ live D2F2/E2 WT cells on the contralateral hind flank (s.c.). (B) Primary tumor growth and tumor free survival curves are shown. (C) Tumor-free mice were subjected to a secondary challenge 77 d post primary challenge. Secondary tumor growth and tumor free survival curves are shown. Mean ±SEM is plotted (n=5/group). Significance relative to PBS, *p< 0.05, **p < 0.01.
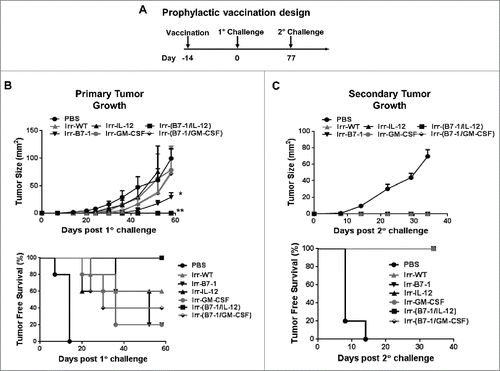
Figure 4. Induction of significant HER-2 specific CTL response following prophylactic vaccination with B7-1 and GPI-IL-12 adjuvanted cellular vaccines. (A) Serum collected from mice 2 weeks after vaccination with cellular vaccines expressing GPI-ISMs (2 × 10⁵) was diluted as indicated to assess for total IgG antibodies against D2F2/E2 WT cells by a cell ELISA as described in Materials and Methods. (B) Splenocytes were isolated from mice 2 weeks post vaccination and re-stimulated in vitro for 5 d with mitomycin-treated D2F2/E2 WT (5:1). CTLs were incubated with D2F2/E2 WT, D2F2 or 4TO7WT target cells for 4 h at indicated effector: target (E:T) ratios. Percentage of specific lysis was quantified by LDH release using the CytoTox 96 Non-Radioactive Cytotoxicity Assay (Promega). ANOVA analysis was used for serum and CTL analysis. Significance relative to PBS, *p < 0.05, **p < 0.01, ***p < 0.001, **** p < 0.0001.
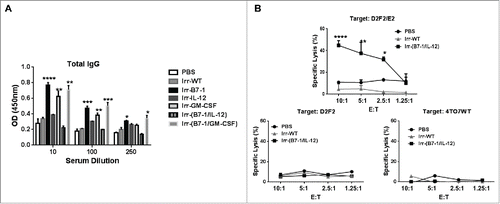
Figure 5. ISM expression by cellular vaccines significantly reduced average tumor burden and prolonged tumor-free survival. (A) Mice were challenged (s.c.) with 2 × 10⁵ live D2F2/E2 WT cells. One week later, mice received one dose of 2 × 10⁵ irradiated cellular vaccines on the contralateral flank (s.c.). (B) Tumor growth and tumor free survival was assessed. (C) D2F2/E2 cells cultured in vitro (Cultured Cells, solid black line) and freshly isolated tumors harvested from WT challenged mice (Tumor, dashed line) were assessed for the expression of PD-L1 by flow cytometry analysis (MFI-mean fluorescence intensity). (D) Splenocytes and tumor infiltrating lymphocytes (TILs) from tumor-bearing mice were isolated and analyzed for PD1 expression on CD8+ and CD4+ T cells by flow cytometry, mean fluorescence intensity (MFI). Data is representative of 2 individual experiments. Significance relative to PBS-treated. *p < 0.05, **p < 0.01, ***p ≤ 0.001.
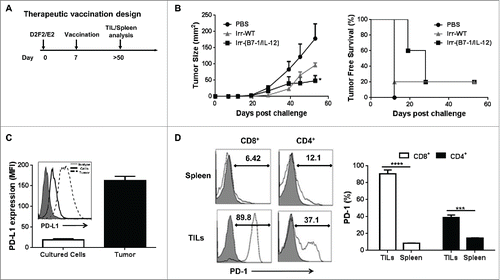
Figure 6. Enhanced therapeutic effect induced following cellular vaccination and PD-L1 blockade. (A) Mice were challenged (s.c.) with 2 × 10⁵ live D2F2/E2 WT cells. One week later, mice received one dose of 2 × 10⁵ irradiated cellular vaccines on the contralateral flank (s.c.). Additional groups of mice were treated with PD-L1 blockade (α-PD-L1: 100µg- i.p.) on days 7, 10 and 13 post tumor challenge either alone or in combination with the cellular vaccine (Combo). (B) Primary tumor growth and tumor incidence curves are shown. (C) Collected serum from treated mice were used to assess for HER-2 specific IgG. (D). Secondary tumor growth and tumor free survival curves are shown. Mean ±SEM is plotted. Representative of 2 individual experiments (n=5/group). Significance relative to PBS-treated mice based on ANOVA analysis. *p < 0.05, **p < 0.01.
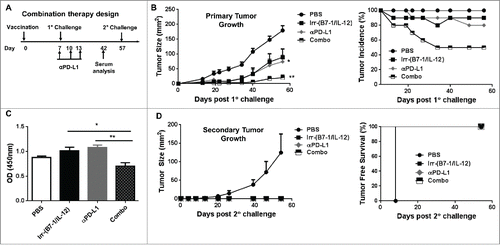
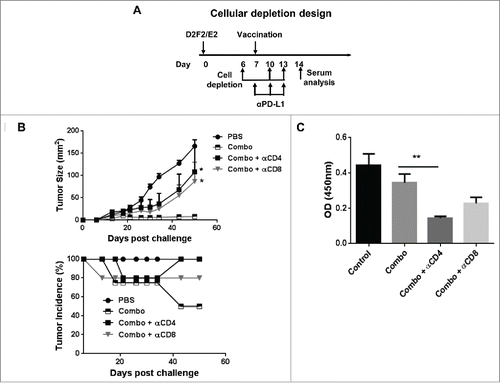
Figure 7. Both CD4+ and CD8+ (T)cells were required for efficacy of the combination therapy. (A) Mice were challenged (s.c.) with 2 × 10⁵ live D2F2/E2 WT cells. One week later, mice received one dose of 2 × 10⁵ irradiated cellular vaccines on the contralateral flank (s.c.) and PD-L1 blockade (100µg- i.p.) as indicated (combo). CD4+ and CD8+ cells were depleted by i.p. injection of 200µg of anti-CD4 (clone GK1.5) and anti-CD8 (clone 2.43) antibodies as indicated. (B) Tumor growth and tumor incidence curves following depletion are shown. (C) Serum collected after cellular depletion was used to assess for HER-2 specific IgG responses. Mean ±SEM is plotted. N=5/group. Significance relative to combination therapy (combo). *p < 0.05, **p< 0.01.